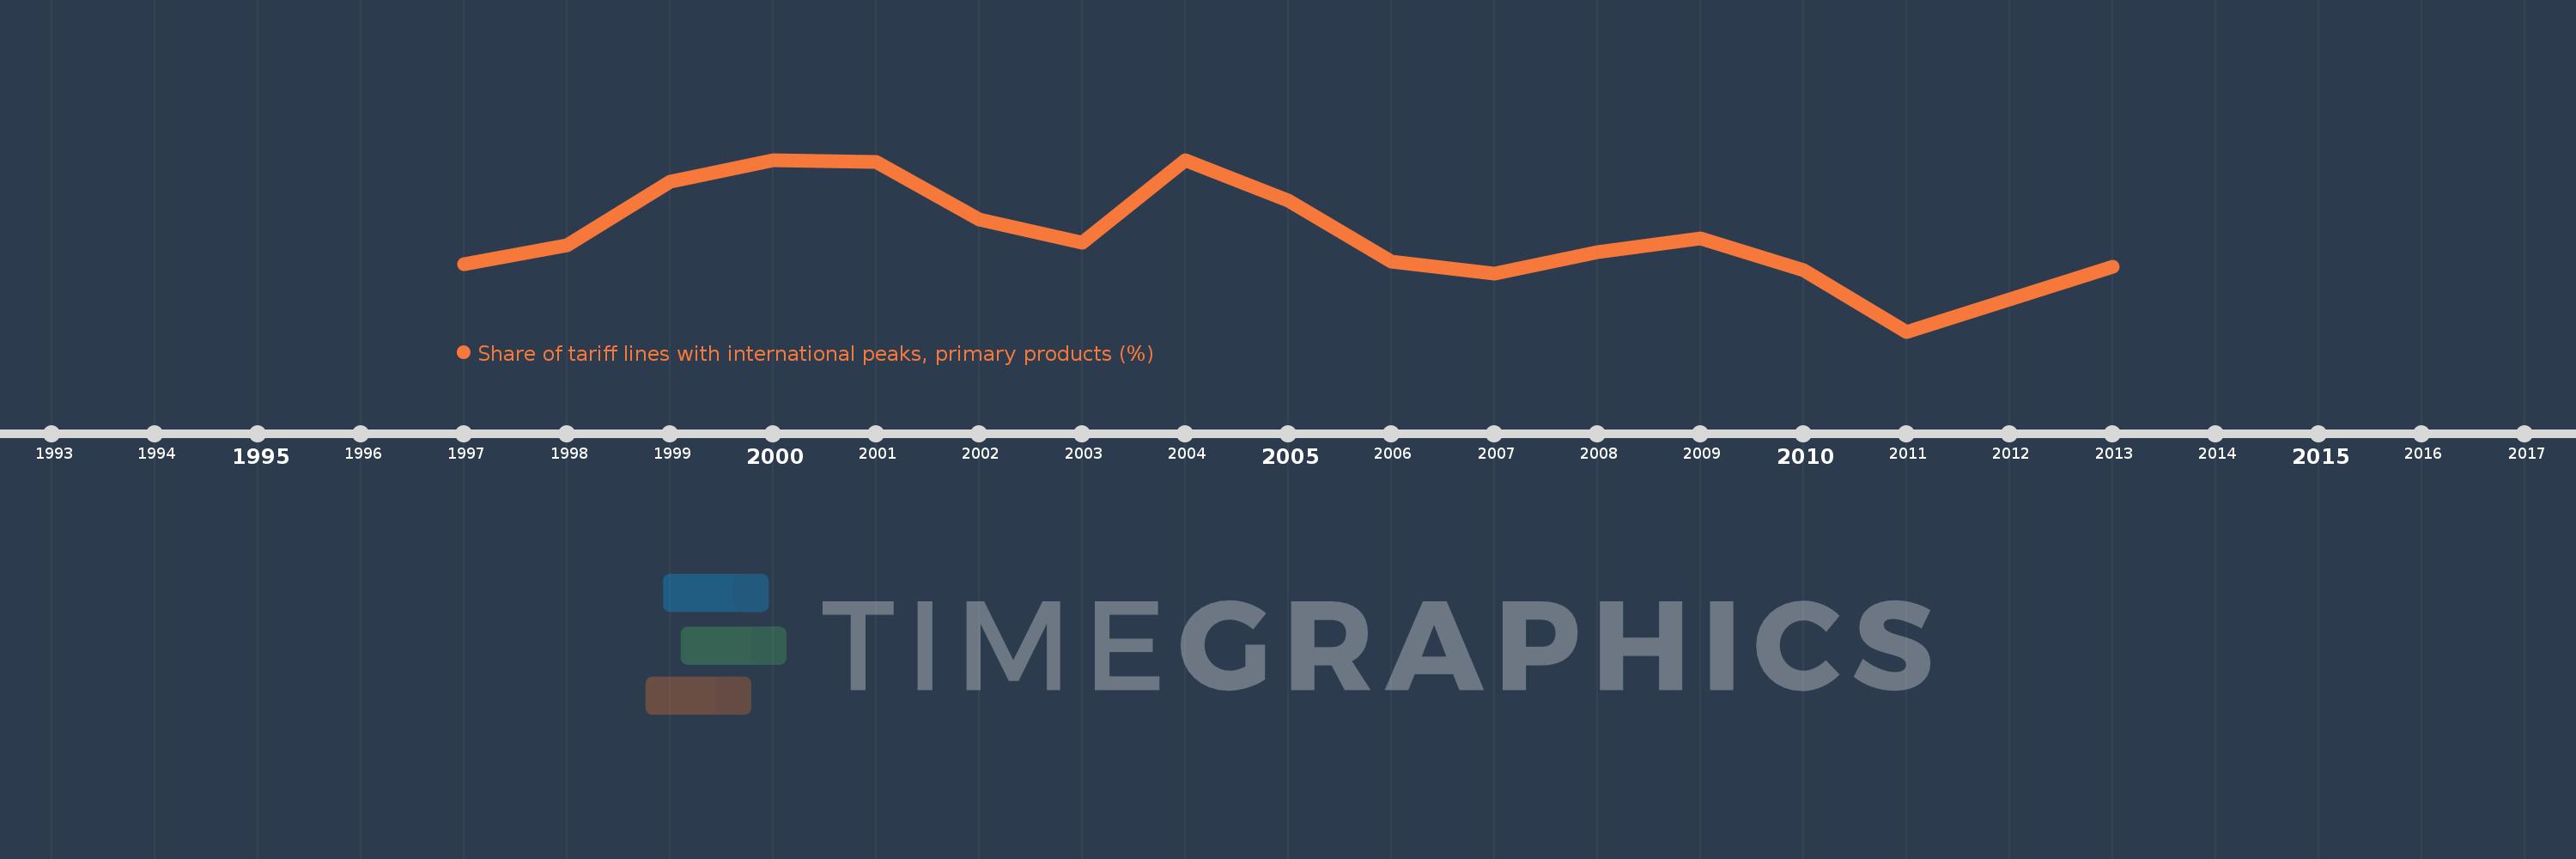
This timeline shows a graph from 1997 to 2013 of Middle income. No data until 1996. Number of actual observations by date: 16.
Source name:
World Development Indicators
Source organization:
World Bank staff estimates using the World Integrated Trade Solution system, based on data from United Nations Conference on Trade and Development's Trade Analysis and Information System (TRAINS) database.
Categories, topics:
Private Sector, Trade
Last updated:
apr 23, 2017
Indicators value changes by year
Meaning:
27.434
Minimum:
18.555
jan 1, 2011
Maximum:
34.043
jan 1, 2000
At the date of observation
Value
Absolute change
Change from the previous value
jan 1, 1997
24.625
+24.625
0.0%
jan 1, 1998
26.344
+1.719
6.98%
jan 1, 1999
32.076
+5.733
21.76%
jan 1, 2000
34.043
+1.967
6.13%
jan 1, 2001
33.841
-0.203
-0.6%
jan 1, 2002
28.655
-5.185
-15.32%
jan 1, 2003
26.577
-2.078
-7.25%
jan 1, 2004
33.973
+7.396
27.83%
jan 1, 2005
30.367
-3.605
-10.61%
jan 1, 2006
24.9
-5.467
-18.0%
jan 1, 2007
23.805
-1.096
-4.4%
jan 1, 2008
25.681
+1.876
7.88%
jan 1, 2009
26.992
+1.312
5.11%
jan 1, 2010
24.065
-2.927
-10.84%
jan 1, 2011
18.555
-5.511
-22.9%
jan 1, 2013
24.44
+5.885
31.72%
Ranking of countries by current statistics by years