33
/
AIzaSyAYiBZKx7MnpbEhh9jyipgxe19OcubqV5w
August 1, 2025
75445
Azerbaijan
AZE
true
2
1
Oil rents (% of GDP)
2016,2015,2014,2013,2012,2011,2010,2009,2008,2007,2006,2005,2004,2003,2002,2001,2000,1999,1998,1997,1996,1995,1994,1993,1992,1991
Download
Global statistics library →Azerbaijan →

Oil rents (% of GDP)

This statistics in other country:

AfghanistanAlbaniaAlgeriaAngolaArab WorldArgentinaArmeniaAustraliaAustriaAzerbaijanBahrainBangladeshBarbadosBelarusBelgiumBelizeBeninBoliviaBosnia and HerzegovinaBotswanaBrazilBrunei DarussalamBulgariaCambodiaCameroonCanadaCaribbean small statesCentral Europe and the BalticsChadChileChinaColombiaCongo, Dem. Rep.Congo, Rep.Costa RicaCote d'IvoireCroatiaCubaCyprusCzech RepublicDenmarkDominican RepublicEarly-demographic dividendEast Asia & PacificEast Asia & Pacific (excluding high income)East Asia & Pacific (IDA & IBRD countries)EcuadorEgypt, Arab Rep.El SalvadorEquatorial GuineaEritreaEstoniaEthiopiaEuro areaEurope & Central AsiaEurope & Central Asia (excluding high income)Europe & Central Asia (IDA & IBRD countries)European UnionFinlandFragile and conflict affected situationsFranceGabonGeorgiaGermanyGhanaGreeceGuatemalaHaitiHeavily indebted poor countries (HIPC)High incomeHondurasHungaryIBRD onlyIcelandIDA & IBRD totalIDA blendIDA onlyIDA totalIndiaIndonesiaIran, Islamic Rep.IraqIrelandIsraelItalyJamaicaJapanJordanKazakhstanKenyaKorea, Rep.KosovoKuwaitKyrgyz RepublicLate-demographic dividendLatin America & Caribbean Latin America & Caribbean (excluding high income)Latin America & the Caribbean (IDA & IBRD countries)LatviaLeast developed countries: UN classificationLebanonLibyaLithuaniaLow & middle incomeLower middle incomeLuxembourgMacedonia, FYRMalaysiaMaltaMauritaniaMauritiusMexicoMiddle East & North AfricaMiddle East & North Africa (excluding high income)Middle East & North Africa (IDA & IBRD countries)Middle incomeMongoliaMontenegroMoroccoMozambiqueMyanmarNamibiaNepalNetherlandsNew ZealandNicaraguaNigerNigeriaNorth AmericaNorwayOECD membersOmanOther small statesPakistanPanamaPapua New GuineaParaguayPeruPhilippinesPolandPortugalPost-demographic dividendPre-demographic dividendQatarRomaniaRussian FederationSaudi ArabiaSenegalSerbiaSingaporeSlovak RepublicSloveniaSmall statesSouth AfricaSouth AsiaSouth Asia (IDA & IBRD)South SudanSpainSri LankaSub-Saharan Africa Sub-Saharan Africa (excluding high income)Sub-Saharan Africa (IDA & IBRD countries)SudanSurinameSwedenSwitzerlandSyrian Arab RepublicTajikistanThailandTimor-LesteTogoTrinidad and TobagoTunisiaTurkeyTurkmenistanUkraineUnited Arab EmiratesUnited KingdomUnited StatesUpper middle incomeUruguayUzbekistanVenezuela, RBVietnamWest Bank and GazaWorldYemen, Rep.ZambiaZimbabwe

Timeline:

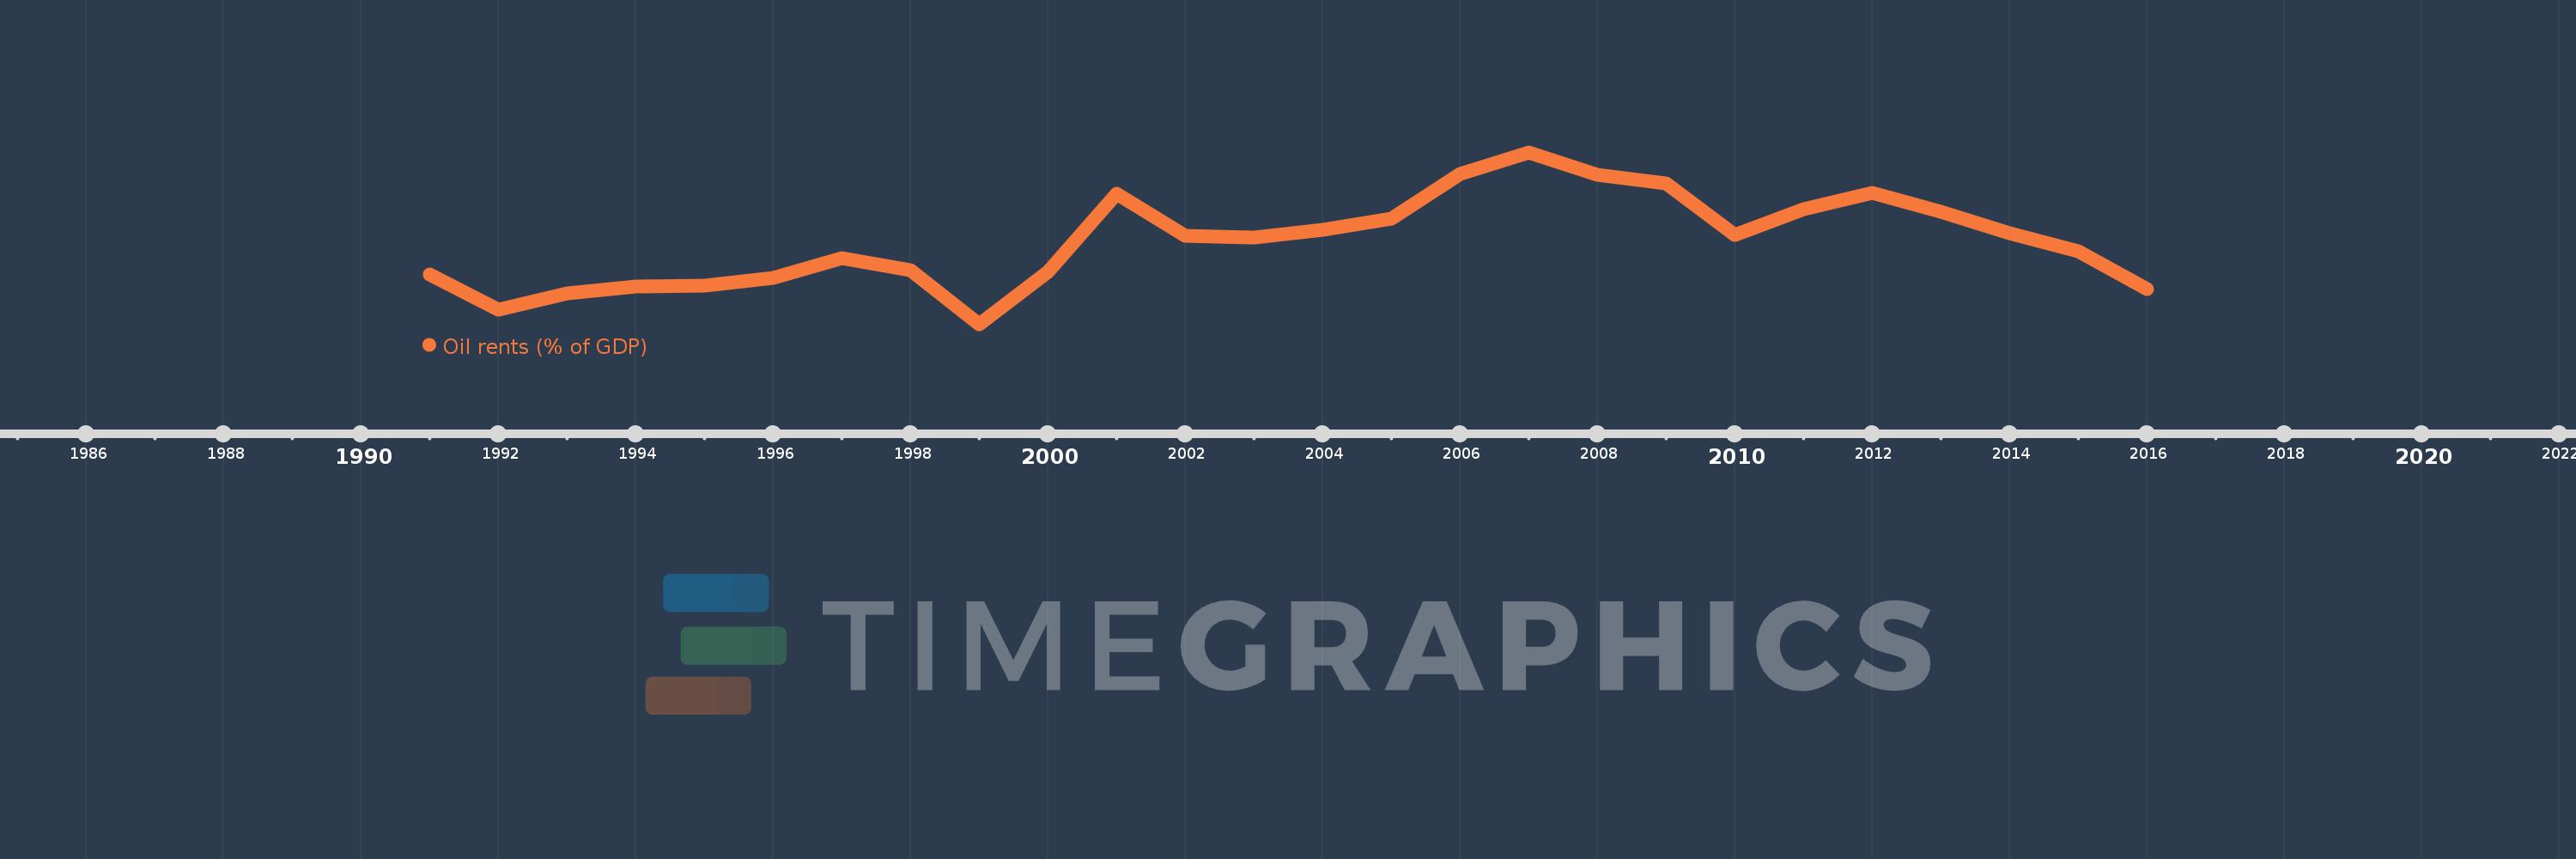
This timeline shows a graph from 1991 to 2016 of Azerbaijan. No data until 1990. Number of actual observations by date: 26.

Source name:

World Development Indicators

Source organization:

Estimates based on sources and methods described in "The Changing Wealth of Nations: Measuring Sustainable Development in the New Millennium" (World Bank, 2011).

Categories, topics:

Energy & Mining, Environment

Last updated:

apr 23, 2017

Indicators value changes by year

Meaning:
21.705
Minimum:
3.06
jan 1, 1999
Maximum:
41.707
jan 1, 2007
At the date of observation
Value
Absolute change
Change from the previous value
jan 1, 1991
14.245
+14.245
0.0%
jan 1, 1992
6.291
-7.954
-55.84%
jan 1, 1993
9.998
+3.708
58.94%
jan 1, 1994
11.469
+1.47
14.71%
jan 1, 1995
11.64
+0.171
1.49%
jan 1, 1996
13.543
+1.903
16.35%
jan 1, 1997
17.89
+4.347
32.1%
jan 1, 1998
15.221
-2.669
-14.92%
jan 1, 1999
3.06
-12.161
-79.9%
jan 1, 2000
14.743
+11.683
381.82%
jan 1, 2001
32.439
+17.696
120.04%
jan 1, 2002
22.951
-9.488
-29.25%
jan 1, 2003
22.515
-0.436
-1.9%
jan 1, 2004
24.389
+1.874
8.33%
jan 1, 2005
26.832
+2.443
10.02%
jan 1, 2006
36.814
+9.982
37.2%
jan 1, 2007
41.707
+4.893
13.29%
jan 1, 2008
36.595
-5.112
-12.26%
jan 1, 2009
34.642
-1.953
-5.34%
jan 1, 2010
23.226
-11.416
-32.95%
jan 1, 2011
28.996
+5.77
24.84%
jan 1, 2012
32.684
+3.688
12.72%
jan 1, 2013
28.44
-4.244
-12.98%
jan 1, 2014
23.599
-4.841
-17.02%
jan 1, 2015
19.394
-4.205
-17.82%
jan 1, 2016
11.001
-8.393
-43.28%

Ranking of countries by current statistics by years