33
/
AIzaSyAYiBZKx7MnpbEhh9jyipgxe19OcubqV5w
August 1, 2025
129725
Estonia
EST
true
2
1
Oil rents (% of GDP)
2016,2015,2014,2013,2012,2011,2010,2009,2008,2007,2006,2005,2004,2003,2002,2001,2000,1999,1998,1997,1996
Download
Global statistics library →Estonia →

Oil rents (% of GDP)

This statistics in other country:

AfghanistanAlbaniaAlgeriaAngolaArab WorldArgentinaArmeniaAustraliaAustriaAzerbaijanBahrainBangladeshBarbadosBelarusBelgiumBelizeBeninBoliviaBosnia and HerzegovinaBotswanaBrazilBrunei DarussalamBulgariaCambodiaCameroonCanadaCaribbean small statesCentral Europe and the BalticsChadChileChinaColombiaCongo, Dem. Rep.Congo, Rep.Costa RicaCote d'IvoireCroatiaCubaCyprusCzech RepublicDenmarkDominican RepublicEarly-demographic dividendEast Asia & PacificEast Asia & Pacific (excluding high income)East Asia & Pacific (IDA & IBRD countries)EcuadorEgypt, Arab Rep.El SalvadorEquatorial GuineaEritreaEstoniaEthiopiaEuro areaEurope & Central AsiaEurope & Central Asia (excluding high income)Europe & Central Asia (IDA & IBRD countries)European UnionFinlandFragile and conflict affected situationsFranceGabonGeorgiaGermanyGhanaGreeceGuatemalaHaitiHeavily indebted poor countries (HIPC)High incomeHondurasHungaryIBRD onlyIcelandIDA & IBRD totalIDA blendIDA onlyIDA totalIndiaIndonesiaIran, Islamic Rep.IraqIrelandIsraelItalyJamaicaJapanJordanKazakhstanKenyaKorea, Rep.KosovoKuwaitKyrgyz RepublicLate-demographic dividendLatin America & Caribbean Latin America & Caribbean (excluding high income)Latin America & the Caribbean (IDA & IBRD countries)LatviaLeast developed countries: UN classificationLebanonLibyaLithuaniaLow & middle incomeLower middle incomeLuxembourgMacedonia, FYRMalaysiaMaltaMauritaniaMauritiusMexicoMiddle East & North AfricaMiddle East & North Africa (excluding high income)Middle East & North Africa (IDA & IBRD countries)Middle incomeMongoliaMontenegroMoroccoMozambiqueMyanmarNamibiaNepalNetherlandsNew ZealandNicaraguaNigerNigeriaNorth AmericaNorwayOECD membersOmanOther small statesPakistanPanamaPapua New GuineaParaguayPeruPhilippinesPolandPortugalPost-demographic dividendPre-demographic dividendQatarRomaniaRussian FederationSaudi ArabiaSenegalSerbiaSingaporeSlovak RepublicSloveniaSmall statesSouth AfricaSouth AsiaSouth Asia (IDA & IBRD)South SudanSpainSri LankaSub-Saharan Africa Sub-Saharan Africa (excluding high income)Sub-Saharan Africa (IDA & IBRD countries)SudanSurinameSwedenSwitzerlandSyrian Arab RepublicTajikistanThailandTimor-LesteTogoTrinidad and TobagoTunisiaTurkeyTurkmenistanUkraineUnited Arab EmiratesUnited KingdomUnited StatesUpper middle incomeUruguayUzbekistanVenezuela, RBVietnamWest Bank and GazaWorldYemen, Rep.ZambiaZimbabwe

Timeline:

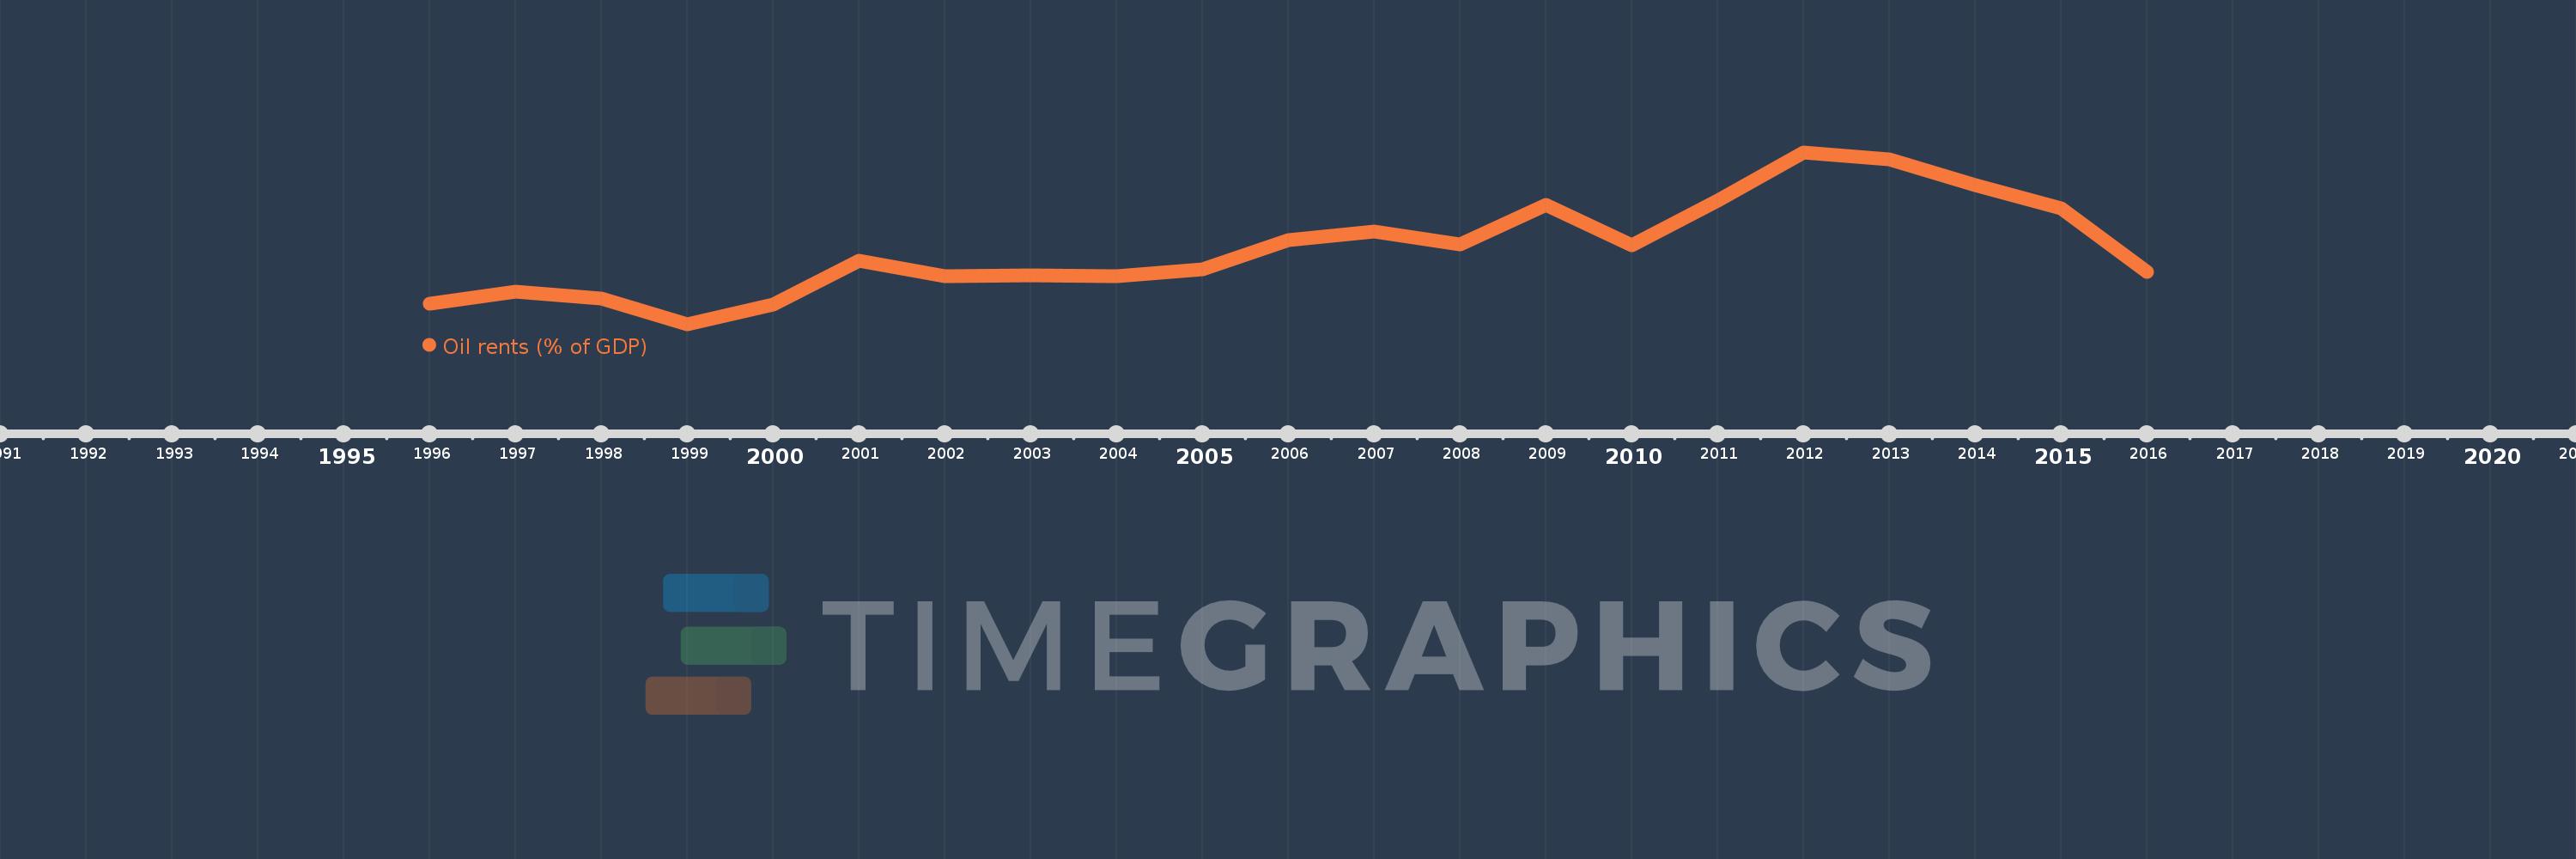
This timeline shows a graph from 1996 to 2016 of Estonia. No data until 1995. Number of actual observations by date: 21.

Source name:

World Development Indicators

Source organization:

Estimates based on sources and methods described in "The Changing Wealth of Nations: Measuring Sustainable Development in the New Millennium" (World Bank, 2011).

Categories, topics:

Energy & Mining, Environment

Last updated:

apr 23, 2017

Indicators value changes by year

Meaning:
0.152
Minimum:
0.011
jan 1, 1999
Maximum:
0.331
jan 1, 2012
At the date of observation
Value
Absolute change
Change from the previous value
jan 1, 1996
0.05
+0.05
0.0%
jan 1, 1997
0.072
+0.022
45.18%
jan 1, 1998
0.059
-0.013
-17.68%
jan 1, 1999
0.011
-0.048
-80.82%
jan 1, 2000
0.047
+0.036
312.32%
jan 1, 2001
0.129
+0.082
175.04%
jan 1, 2002
0.1
-0.03
-23.02%
jan 1, 2003
0.102
+0.002
2.28%
jan 1, 2004
0.101
-0.001
-0.7%
jan 1, 2005
0.113
+0.012
12.03%
jan 1, 2006
0.168
+0.054
48.07%
jan 1, 2007
0.184
+0.016
9.53%
jan 1, 2008
0.16
-0.024
-12.92%
jan 1, 2009
0.233
+0.073
45.71%
jan 1, 2010
0.158
-0.075
-32.31%
jan 1, 2011
0.242
+0.084
53.57%
jan 1, 2012
0.331
+0.089
36.83%
jan 1, 2013
0.318
-0.013
-3.93%
jan 1, 2014
0.27
-0.049
-15.29%
jan 1, 2015
0.227
-0.043
-15.79%
jan 1, 2016
0.108
-0.119
-52.25%

Ranking of countries by current statistics by years