29
/
en
AIzaSyAYiBZKx7MnpbEhh9jyipgxe19OcubqV5w
April 1, 2024
173288
Kyrgyz Republic
KGZ
true
2
1
Oil rents (% of GDP)
2016,2015,2014,2013,2012,2011,2010,2009,2008,2007,2006,2005,2004,2003,2002,2001,2000,1999,1998,1997,1996,1995,1994,1993,1992,1991
Download
Global statistics library →Kyrgyz Republic →

Oil rents (% of GDP)

This statistics in other country:
AfghanistanAlbaniaAlgeriaAngolaArab WorldArgentinaArmeniaAustraliaAustriaAzerbaijanBahrainBangladeshBarbadosBelarusBelgiumBelizeBeninBoliviaBosnia and HerzegovinaBotswanaBrazilBrunei DarussalamBulgariaCambodiaCameroonCanadaCaribbean small statesCentral Europe and the BalticsChadChileChinaColombiaCongo, Dem. Rep.Congo, Rep.Costa RicaCote d'IvoireCroatiaCubaCyprusCzech RepublicDenmarkDominican RepublicEarly-demographic dividendEast Asia & PacificEast Asia & Pacific (excluding high income)East Asia & Pacific (IDA & IBRD countries)EcuadorEgypt, Arab Rep.El SalvadorEquatorial GuineaEritreaEstoniaEthiopiaEuro areaEurope & Central AsiaEurope & Central Asia (excluding high income)Europe & Central Asia (IDA & IBRD countries)European UnionFinlandFragile and conflict affected situationsFranceGabonGeorgiaGermanyGhanaGreeceGuatemalaHaitiHeavily indebted poor countries (HIPC)High incomeHondurasHungaryIBRD onlyIcelandIDA & IBRD totalIDA blendIDA onlyIDA totalIndiaIndonesiaIran, Islamic Rep.IraqIrelandIsraelItalyJamaicaJapanJordanKazakhstanKenyaKorea, Rep.KosovoKuwaitKyrgyz RepublicLate-demographic dividendLatin America & Caribbean Latin America & Caribbean (excluding high income)Latin America & the Caribbean (IDA & IBRD countries)LatviaLeast developed countries: UN classificationLebanonLibyaLithuaniaLow & middle incomeLower middle incomeLuxembourgMacedonia, FYRMalaysiaMaltaMauritaniaMauritiusMexicoMiddle East & North AfricaMiddle East & North Africa (excluding high income)Middle East & North Africa (IDA & IBRD countries)Middle incomeMongoliaMontenegroMoroccoMozambiqueMyanmarNamibiaNepalNetherlandsNew ZealandNicaraguaNigerNigeriaNorth AmericaNorwayOECD membersOmanOther small statesPakistanPanamaPapua New GuineaParaguayPeruPhilippinesPolandPortugalPost-demographic dividendPre-demographic dividendQatarRomaniaRussian FederationSaudi ArabiaSenegalSerbiaSingaporeSlovak RepublicSloveniaSmall statesSouth AfricaSouth AsiaSouth Asia (IDA & IBRD)South SudanSpainSri LankaSub-Saharan Africa Sub-Saharan Africa (excluding high income)Sub-Saharan Africa (IDA & IBRD countries)SudanSurinameSwedenSwitzerlandSyrian Arab RepublicTajikistanThailandTimor-LesteTogoTrinidad and TobagoTunisiaTurkeyTurkmenistanUkraineUnited Arab EmiratesUnited KingdomUnited StatesUpper middle incomeUruguayUzbekistanVenezuela, RBVietnamWest Bank and GazaWorldYemen, Rep.ZambiaZimbabwe
Timeline:
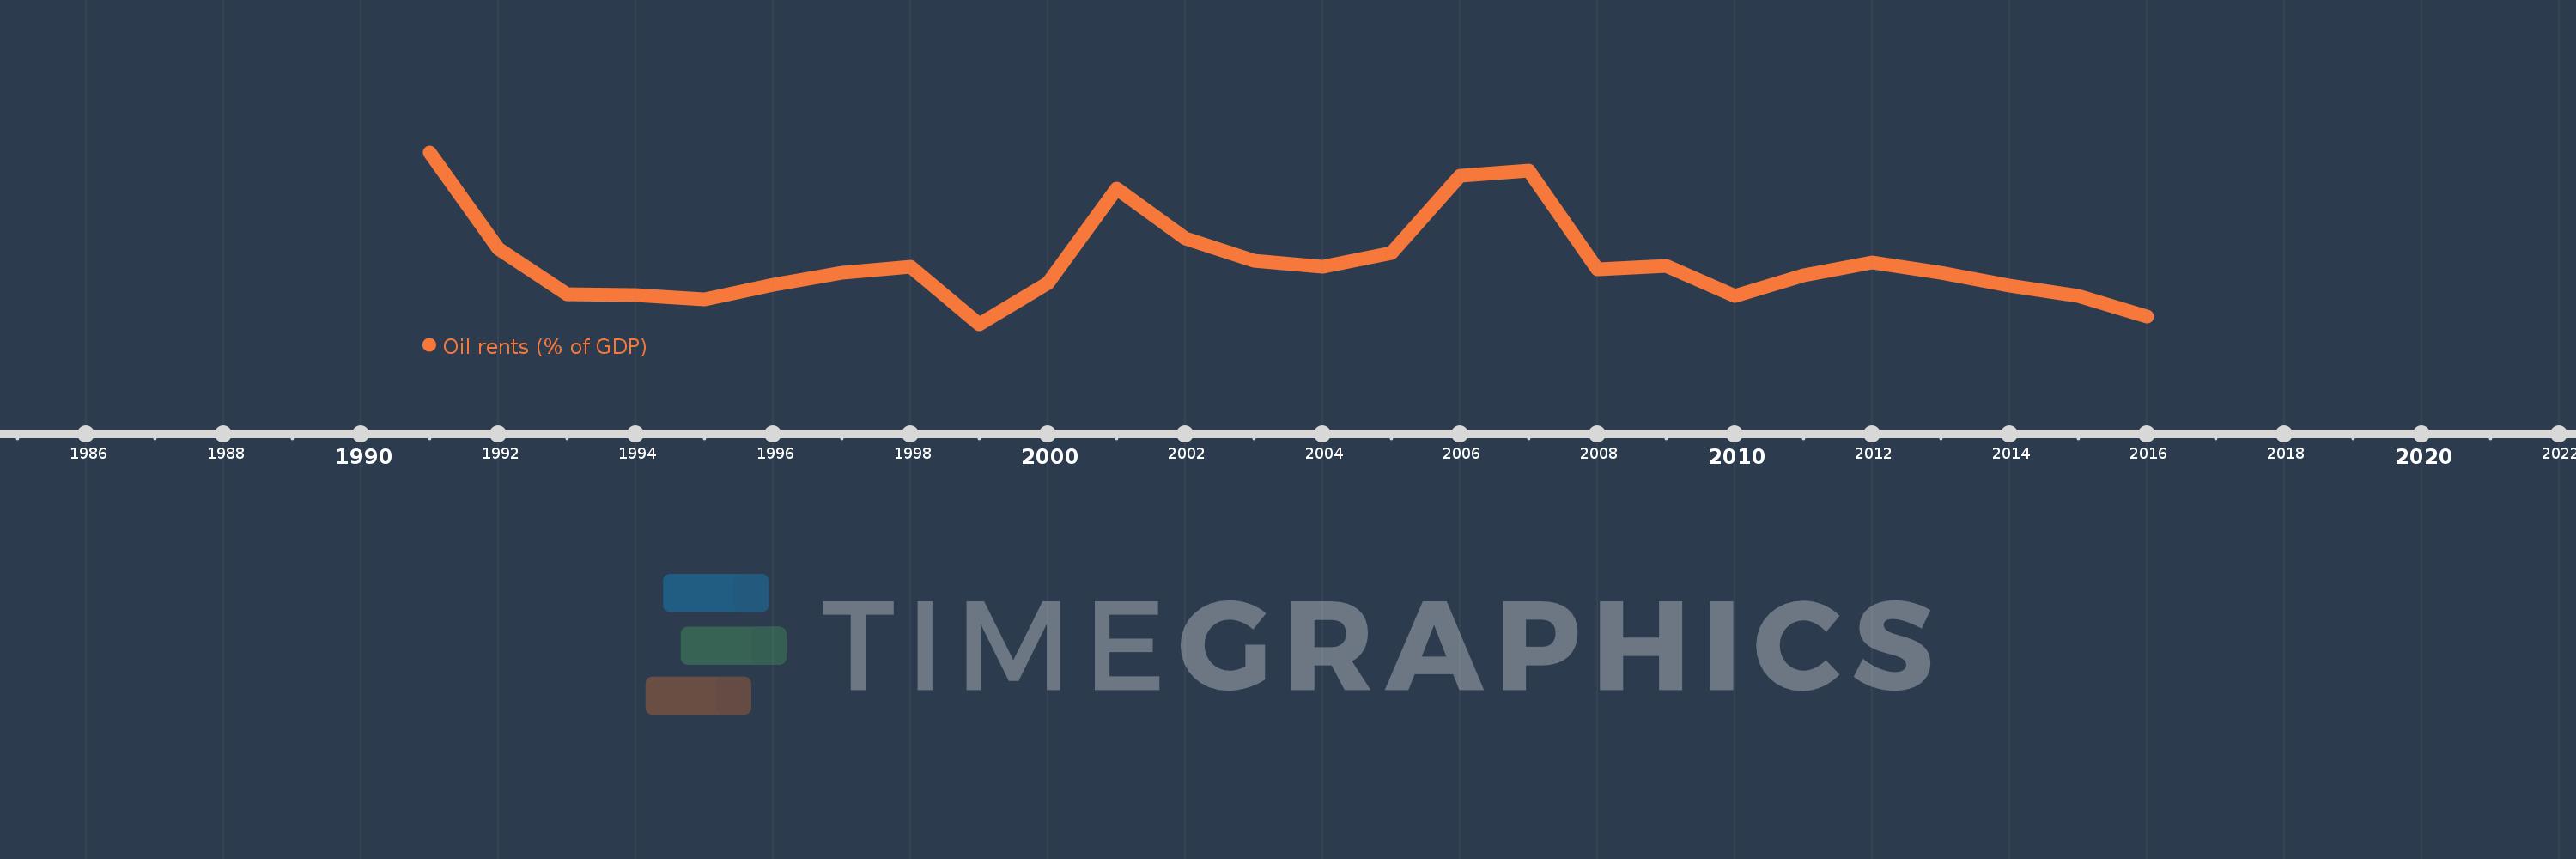
This timeline shows a graph from 1991 to 2016 of Kyrgyz Republic. No data until 1990. Number of actual observations by date: 26.
Source name:
World Development Indicators
Source organization:
Estimates based on sources and methods described in "The Changing Wealth of Nations: Measuring Sustainable Development in the New Millennium" (World Bank, 2011).
Categories, topics:
Energy & Mining, Environment
Last updated:
apr 23, 2017
Indicators value changes by year
Mean:
0.426
Minimum:
0.057
jan 1, 1999
Maximum:
1.077
jan 1, 1991
At the date of observation
Value
Absolute change
Change from previous value
jan 1, 1991
1.077
+1.077
0.0%
jan 1, 1992
0.504
-0.573
-53.17%
jan 1, 1993
0.236
-0.268
-53.14%
jan 1, 1994
0.229
-0.007
-3.14%
jan 1, 1995
0.206
-0.022
-9.8%
jan 1, 1996
0.291
+0.084
40.86%
jan 1, 1997
0.365
+0.074
25.59%
jan 1, 1998
0.396
+0.031
8.43%
jan 1, 1999
0.057
-0.339
-85.54%
jan 1, 2000
0.303
+0.246
429.33%
jan 1, 2001
0.863
+0.56
184.65%
jan 1, 2002
0.565
-0.298
-34.53%
jan 1, 2003
0.435
-0.129
-22.91%
jan 1, 2004
0.398
-0.038
-8.69%
jan 1, 2005
0.481
+0.083
20.94%
jan 1, 2006
0.939
+0.458
95.25%
jan 1, 2007
0.967
+0.028
2.96%
jan 1, 2008
0.381
-0.585
-60.55%
jan 1, 2009
0.401
+0.02
5.26%
jan 1, 2010
0.224
-0.177
-44.21%
jan 1, 2011
0.347
+0.123
54.96%
jan 1, 2012
0.424
+0.077
22.15%
jan 1, 2013
0.363
-0.061
-14.44%
jan 1, 2014
0.288
-0.075
-20.73%
jan 1, 2015
0.226
-0.061
-21.34%
jan 1, 2016
0.1
-0.126
-55.68%
Ranking of countries by current statistics by years

Comments:

Send
PremiumAbout & FeedbackTermsPrivacy
logo
© 2022 Selected Technologies LLC – Morgan Hill, California