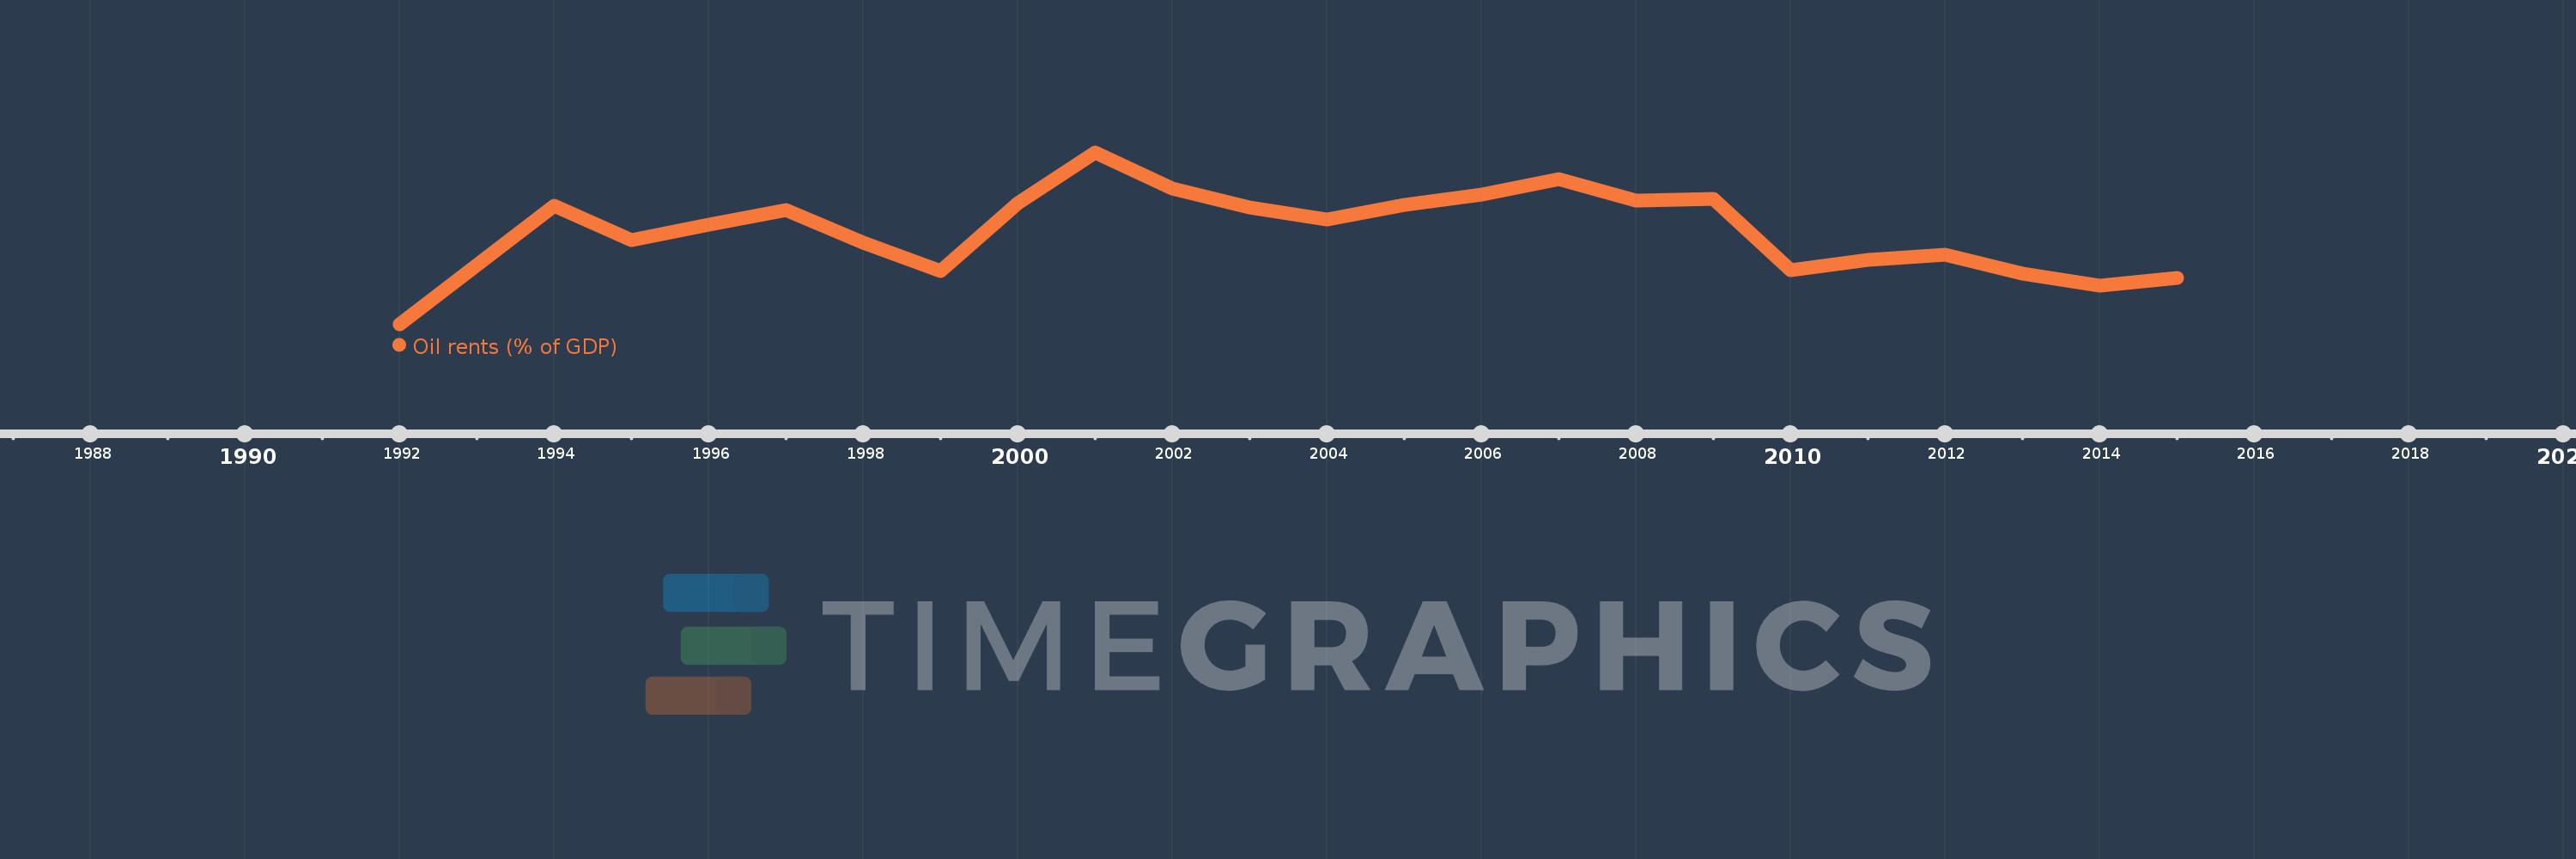
This timeline shows a graph from 1992 to 2015 of Papua New Guinea. No data until 1991. Number of actual observations by date: 24.
Source name:
World Development Indicators
Source organization:
Estimates based on sources and methods described in "The Changing Wealth of Nations: Measuring Sustainable Development in the New Millennium" (World Bank, 2011).
Categories, topics:
Energy & Mining, Environment
Last updated:
apr 23, 2017
Indicators value changes by year
Meaning:
8.008
Minimum:
0.02
jan 1, 1992
Maximum:
14.809
jan 1, 2001
At the date of observation
Value
Absolute change
Change from the previous value
jan 1, 1992
0.02
+0.02
0.0%
jan 1, 1993
5.12
+5.1
25.34K%
jan 1, 1994
10.252
+5.133
100.25%
jan 1, 1995
7.264
-2.988
-29.15%
jan 1, 1996
8.578
+1.314
18.09%
jan 1, 1997
9.854
+1.275
14.87%
jan 1, 1998
7.006
-2.847
-28.9%
jan 1, 1999
4.578
-2.428
-34.65%
jan 1, 2000
10.426
+5.848
127.72%
jan 1, 2001
14.809
+4.384
42.04%
jan 1, 2002
11.698
-3.111
-21.01%
jan 1, 2003
10.059
-1.64
-14.02%
jan 1, 2004
9.05
-1.009
-10.03%
jan 1, 2005
10.326
+1.275
14.09%
jan 1, 2006
11.193
+0.868
8.4%
jan 1, 2007
12.543
+1.349
12.05%
jan 1, 2008
10.649
-1.894
-15.1%
jan 1, 2009
10.788
+0.139
1.31%
jan 1, 2010
4.637
-6.151
-57.01%
jan 1, 2011
5.594
+0.957
20.63%
jan 1, 2012
6.003
+0.409
7.31%
jan 1, 2013
4.377
-1.625
-27.08%
jan 1, 2014
3.322
-1.055
-24.11%
jan 1, 2015
4.035
+0.713
21.48%
Ranking of countries by current statistics by years