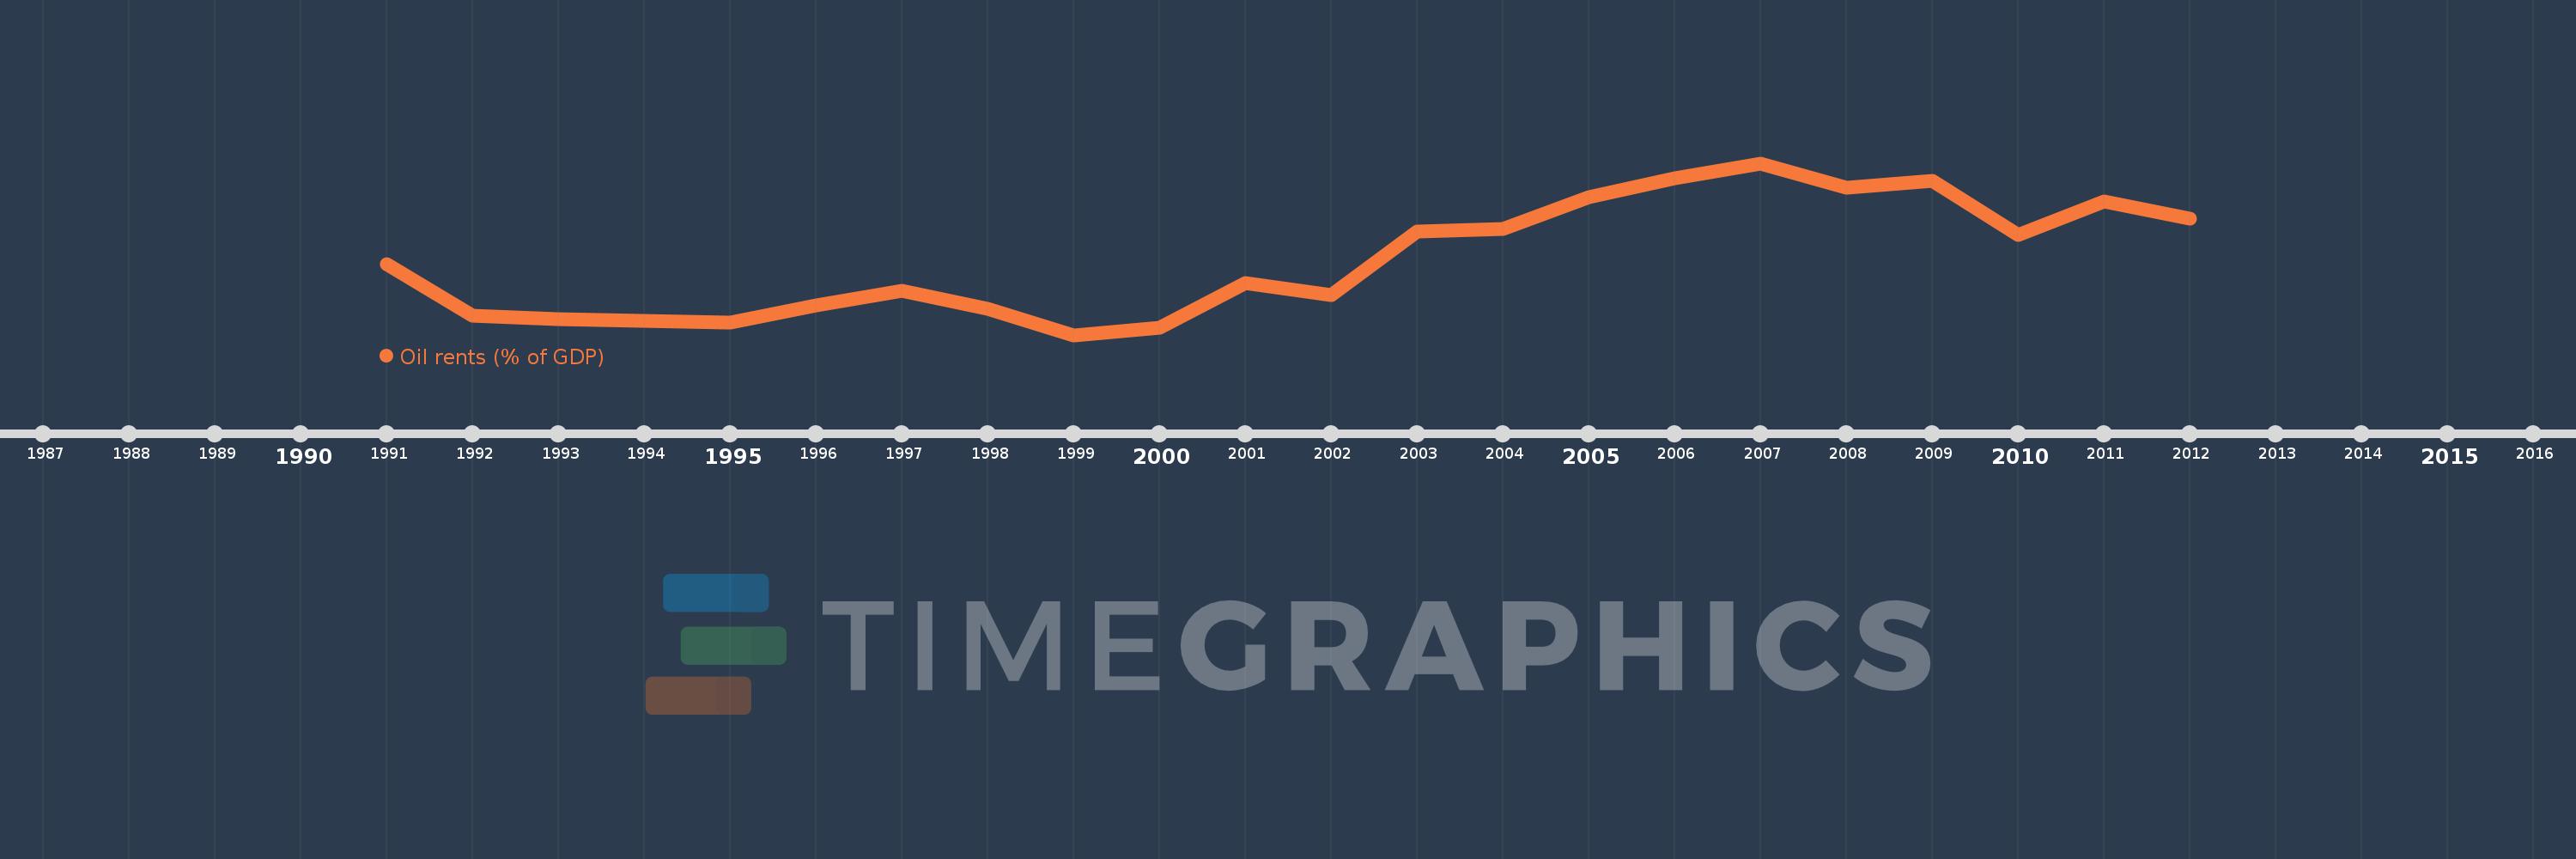
This timeline shows a graph from 1991 to 2012 of Libya. No data until 1990. Number of actual observations by date: 22.
Source name:
World Development Indicators
Source organization:
Estimates based on sources and methods described in "The Changing Wealth of Nations: Measuring Sustainable Development in the New Millennium" (World Bank, 2011).
Categories, topics:
Energy & Mining, Environment
Last updated:
apr 23, 2017
Indicators value changes by year
Meaning:
37.04
Minimum:
14.832
jan 1, 1999
Maximum:
65.42
jan 1, 2007
At the date of observation
Value
Absolute change
Change from the previous value
jan 1, 1991
35.772
+35.772
0.0%
jan 1, 1992
20.57
-15.202
-42.5%
jan 1, 1993
19.493
-1.077
-5.24%
jan 1, 1994
18.99
-0.503
-2.58%
jan 1, 1995
18.426
-0.564
-2.97%
jan 1, 1996
23.471
+5.045
27.38%
jan 1, 1997
27.945
+4.475
19.06%
jan 1, 1998
22.446
-5.5
-19.68%
jan 1, 1999
14.832
-7.614
-33.92%
jan 1, 2000
16.94
+2.107
14.21%
jan 1, 2001
30.068
+13.128
77.5%
jan 1, 2002
26.635
-3.433
-11.42%
jan 1, 2003
45.382
+18.748
70.39%
jan 1, 2004
45.96
+0.577
1.27%
jan 1, 2005
55.442
+9.483
20.63%
jan 1, 2006
60.895
+5.452
9.83%
jan 1, 2007
65.42
+4.526
7.43%
jan 1, 2008
58.277
-7.143
-10.92%
jan 1, 2009
60.206
+1.929
3.31%
jan 1, 2010
44.382
-15.825
-26.28%
jan 1, 2011
54.113
+9.731
21.93%
jan 1, 2012
49.21
-4.903
-9.06%
Ranking of countries by current statistics by years