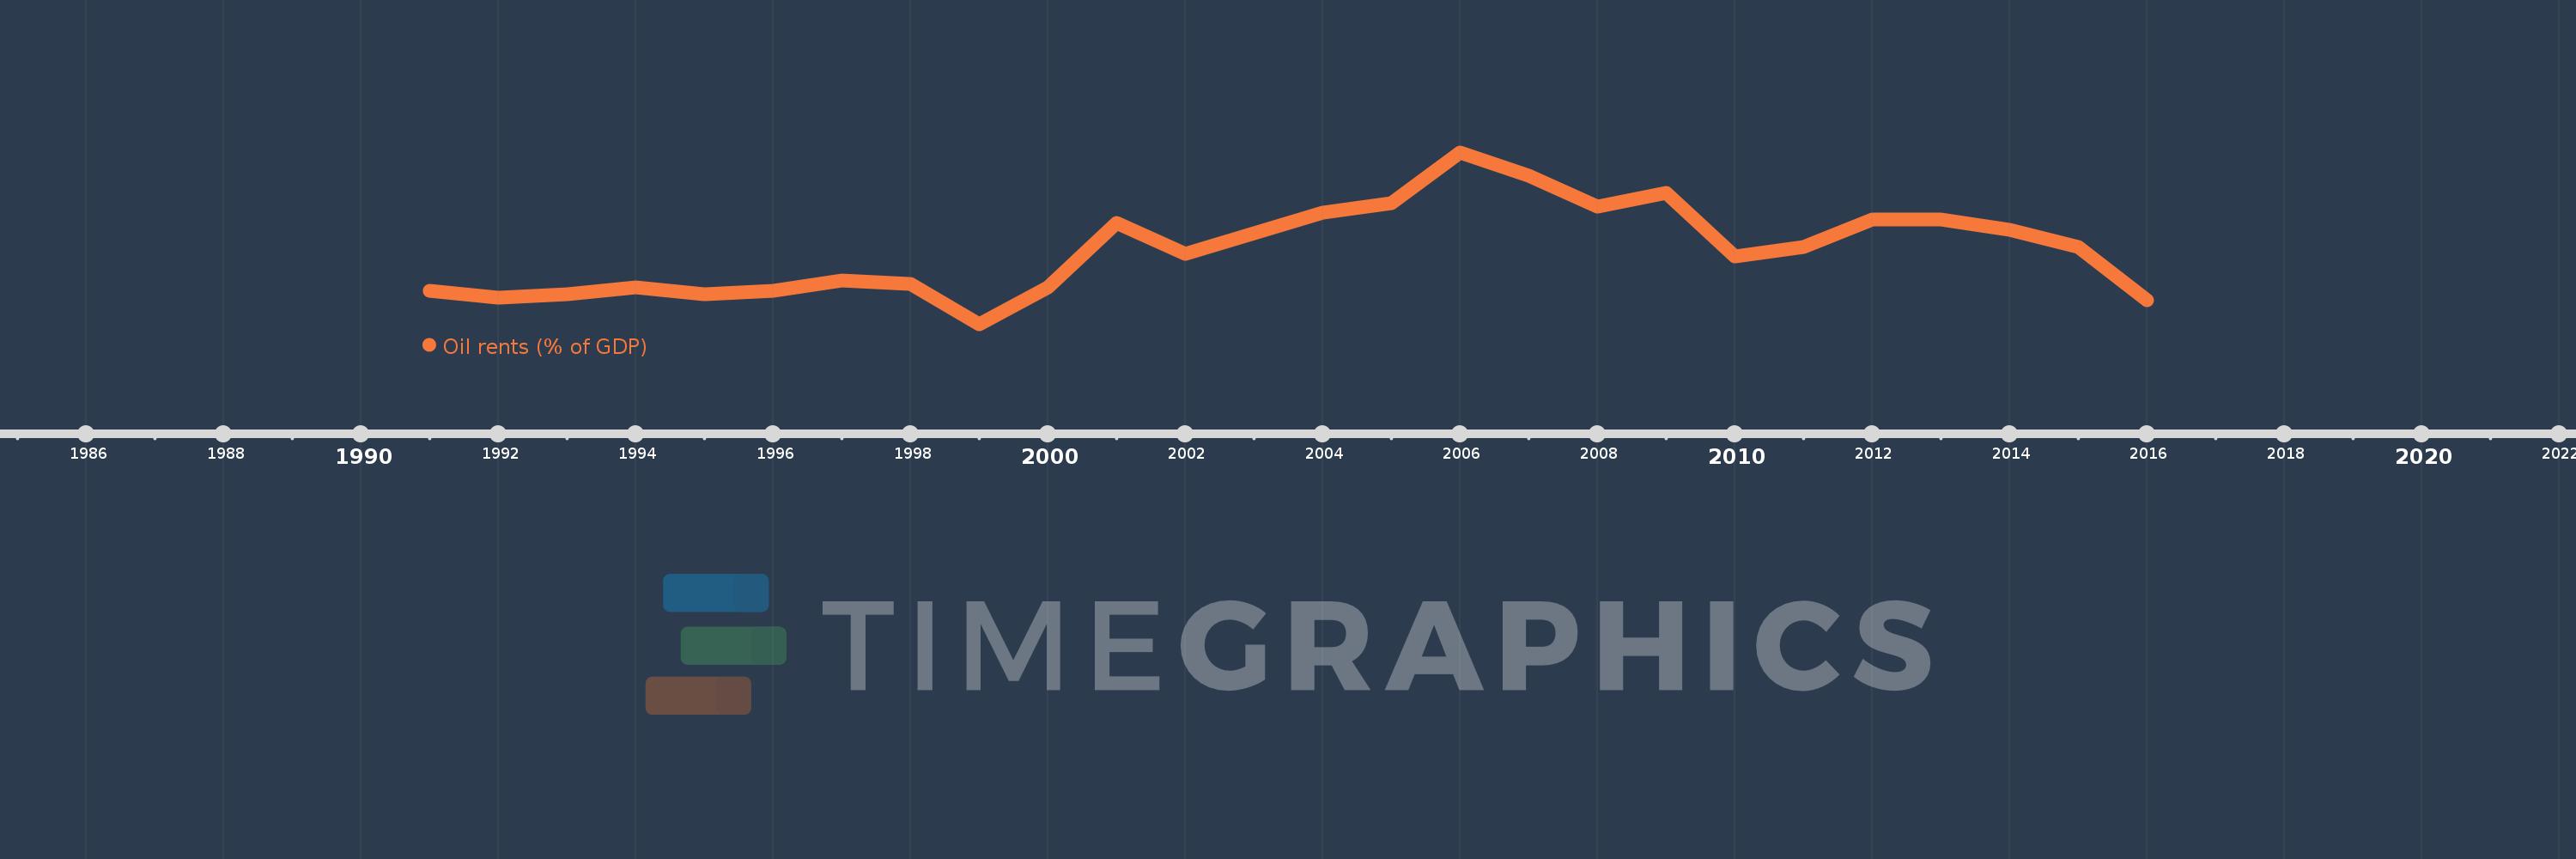
This timeline shows a graph from 1991 to 2016 of Czech Republic. No data until 1990. Number of actual observations by date: 26.
Source name:
World Development Indicators
Source organization:
Estimates based on sources and methods described in "The Changing Wealth of Nations: Measuring Sustainable Development in the New Millennium" (World Bank, 2011).
Categories, topics:
Energy & Mining, Environment
Last updated:
apr 23, 2017
Indicators value changes by year
Meaning:
0.025
Minimum:
0.003
jan 1, 1999
Maximum:
0.054
jan 1, 2006
At the date of observation
Value
Absolute change
Change from the previous value
jan 1, 1991
0.013
+0.013
0.0%
jan 1, 1992
0.011
-0.002
-11.93%
jan 1, 1993
0.012
+0.001
5.84%
jan 1, 1994
0.014
+0.001
11.98%
jan 1, 1995
0.012
-0.001
-9.25%
jan 1, 1996
0.013
+0.0
1.52%
jan 1, 1997
0.016
+0.004
28.59%
jan 1, 1998
0.015
-0.001
-8.44%
jan 1, 1999
0.003
-0.012
-78.32%
jan 1, 2000
0.014
+0.011
340.75%
jan 1, 2001
0.033
+0.019
135.71%
jan 1, 2002
0.024
-0.01
-29.06%
jan 1, 2003
0.03
+0.007
27.53%
jan 1, 2004
0.036
+0.006
18.3%
jan 1, 2005
0.039
+0.004
10.38%
jan 1, 2006
0.054
+0.014
36.44%
jan 1, 2007
0.047
-0.006
-11.82%
jan 1, 2008
0.038
-0.009
-19.41%
jan 1, 2009
0.042
+0.003
8.81%
jan 1, 2010
0.023
-0.019
-44.86%
jan 1, 2011
0.026
+0.003
14.68%
jan 1, 2012
0.034
+0.008
30.05%
jan 1, 2013
0.034
0.0
-0.97%
jan 1, 2014
0.031
-0.003
-9.61%
jan 1, 2015
0.026
-0.004
-13.62%
jan 1, 2016
0.01
-0.016
-60.82%
Ranking of countries by current statistics by years