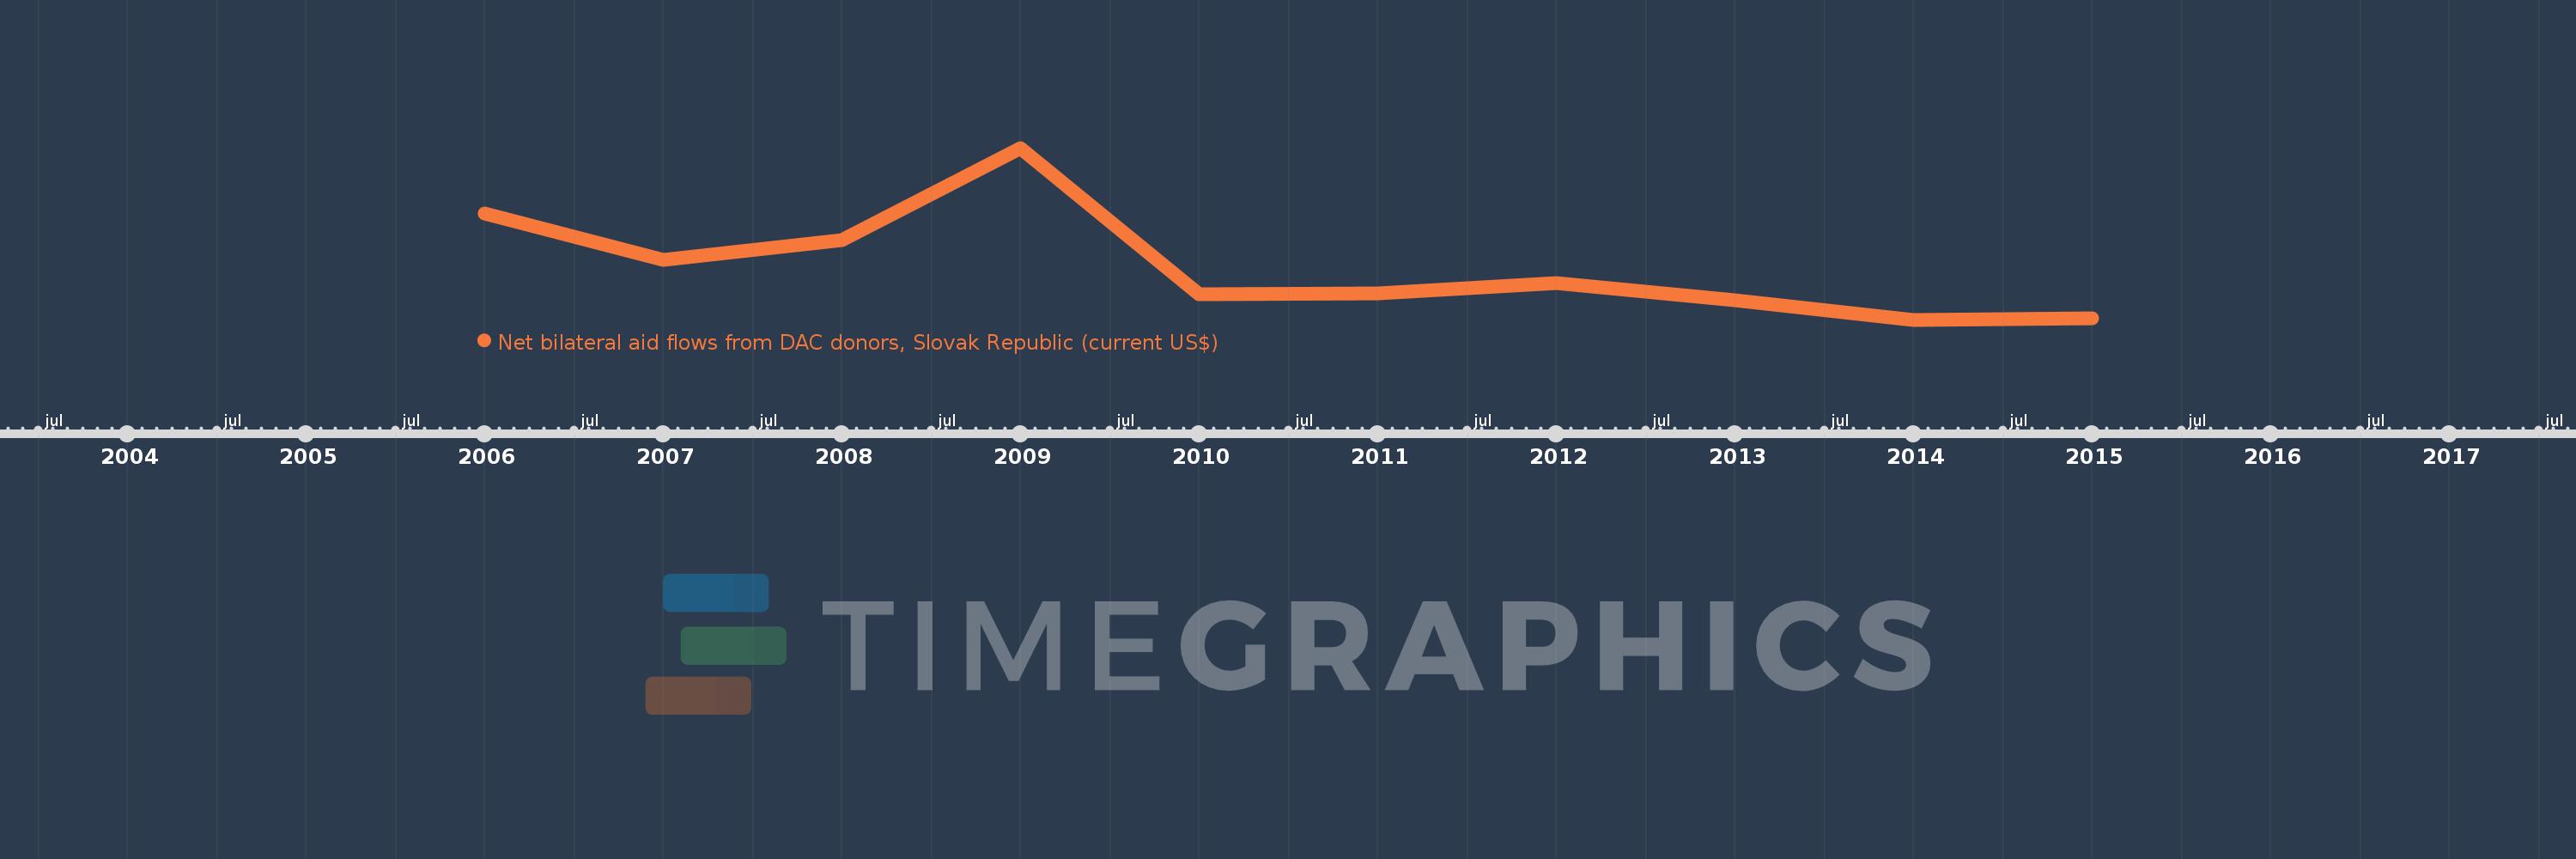
This timeline shows a graph from 2006 to 2015 of World. No data until 2005. Number of actual observations by date: 10.
Source name:
World Development Indicators
Source organization:
Development Assistance Committee of the Organisation for Economic Co-operation and Development, Geographical Distribution of Financial Flows to Developing Countries, Development Co-operation Report, and International Development Statistics database. Data are available online at: www.oecd.org/dac/stats/idsonline.
Categories, topics:
Aid Effectiveness
Last updated:
apr 23, 2017
Indicators value changes by year
Meaning:
23.731 mln
Minimum:
16.18 mln
jan 1, 2014
Maximum:
40.82 mln
jan 1, 2009
At the date of observation
Value
Absolute change
Change from the previous value
jan 1, 2006
31.43 mln
+31.43 mln
0.0%
jan 1, 2007
24.75 mln
-6.68 mln
-21.25%
jan 1, 2008
27.6 mln
+2.85 mln
11.52%
jan 1, 2009
40.82 mln
+13.22 mln
47.9%
jan 1, 2010
19.83 mln
-20.99 mln
-51.42%
jan 1, 2011
19.94 mln
+110.0K
0.55%
jan 1, 2012
21.43 mln
+1.49 mln
7.47%
jan 1, 2013
18.95 mln
-2.48 mln
-11.57%
jan 1, 2014
16.18 mln
-2.77 mln
-14.62%
jan 1, 2015
16.38 mln
+200.0K
1.24%
Ranking of countries by current statistics by years