33
/
AIzaSyAYiBZKx7MnpbEhh9jyipgxe19OcubqV5w
August 1, 2025
61014
Sub-Saharan Africa (IDA & IBRD countries)
TSS
false
2
1
Net bilateral aid flows from DAC donors, Slovak Republic (current US$)
2015,2014,2013,2012,2011,2010,2009,2008,2007,2006
Download
Global statistics library →Sub-Saharan Africa (IDA & IBRD countries) →

Net bilateral aid flows from DAC donors, Slovak Republic (current US$)

This statistics in other country:

AfghanistanAlbaniaAngolaArab WorldArmeniaAzerbaijanBangladeshBelarusBeninBosnia and HerzegovinaBrazilBurundiCambodiaCentral Europe and the BalticsChileChinaColombiaCosta RicaCroatiaCubaEast Asia & PacificEast Asia & Pacific (excluding high income)East Asia & Pacific (IDA & IBRD countries)EcuadorEgypt, Arab Rep.EthiopiaEurope & Central AsiaEurope & Central Asia (excluding high income)Europe & Central Asia (IDA & IBRD countries)European UnionFragile and conflict affected situationsGambia, TheGeorgiaHaitiHeavily indebted poor countries (HIPC)High incomeIBRD onlyIDA & IBRD totalIDA blendIDA onlyIDA totalIndiaIndonesiaIraqJordanKazakhstanKenyaKosovoKyrgyz RepublicLao PDRLatin America & Caribbean Latin America & Caribbean (excluding high income)Latin America & the Caribbean (IDA & IBRD countries)Least developed countries: UN classificationLebanonLesothoLiberiaLibyaLow & middle incomeLow incomeLower middle incomeMacedonia, FYRMadagascarMaliMexicoMiddle East & North AfricaMiddle East & North Africa (excluding high income)Middle East & North Africa (IDA & IBRD countries)Middle incomeMoldovaMongoliaMontenegroMozambiqueMyanmarNamibiaNepalNicaraguaOECD membersOther small statesPakistanParaguayPeruPhilippinesRwandaSerbiaSmall statesSouth AsiaSouth Asia (IDA & IBRD)South SudanSub-Saharan Africa Sub-Saharan Africa (excluding high income)Sub-Saharan Africa (IDA & IBRD countries)SudanSyrian Arab RepublicTajikistanTanzaniaThailandTunisiaTurkeyUgandaUkraineUpper middle incomeUzbekistanVietnamWest Bank and GazaWorldYemen, Rep.

Timeline:

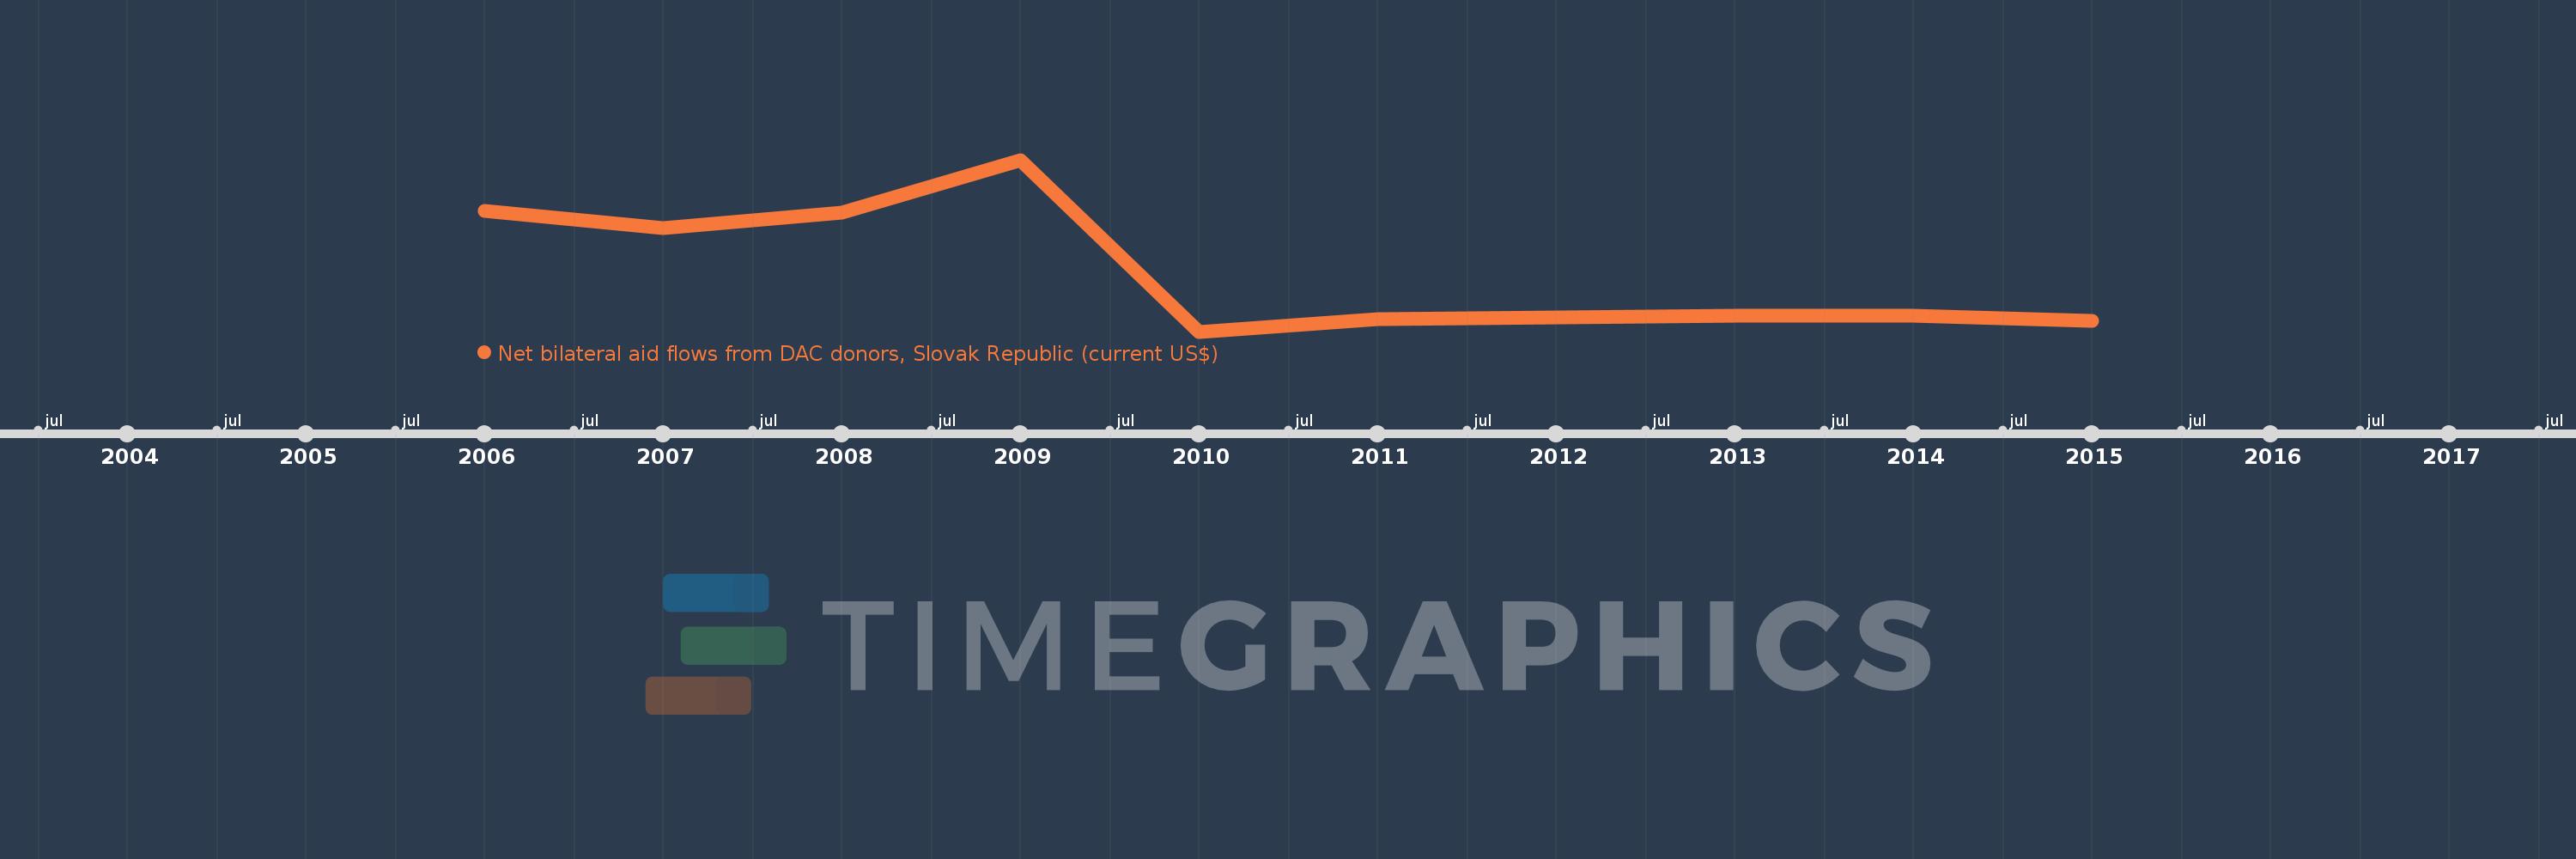
This timeline shows a graph from 2006 to 2015 of Sub-Saharan Africa (IDA & IBRD countries). No data until 2005. Number of actual observations by date: 10.

Source name:

World Development Indicators

Source organization:

Development Assistance Committee of the Organisation for Economic Co-operation and Development, Geographical Distribution of Financial Flows to Developing Countries, Development Co-operation Report, and International Development Statistics database. Data are available online at: www.oecd.org/dac/stats/idsonline.

Categories, topics:

Aid Effectiveness

Last updated:

apr 23, 2017

Indicators value changes by year

Meaning:
8.868 mln
Minimum:
170.0K
jan 1, 2010
Maximum:
25.73 mln
jan 1, 2009
At the date of observation
Value
Absolute change
Change from the previous value
jan 1, 2006
18.14 mln
+18.14 mln
0.0%
jan 1, 2007
15.58 mln
-2.56 mln
-14.11%
jan 1, 2008
17.88 mln
+2.3 mln
14.76%
jan 1, 2009
25.73 mln
+7.85 mln
43.9%
jan 1, 2010
170.0K
-25.56 mln
-99.34%
jan 1, 2011
2.03 mln
+1.86 mln
1.09K%
jan 1, 2012
2.26 mln
+230.0K
11.33%
jan 1, 2013
2.59 mln
+330.0K
14.6%
jan 1, 2014
2.5 mln
-90.0K
-3.47%
jan 1, 2015
1.8 mln
-700.0K
-28.0%

Ranking of countries by current statistics by years