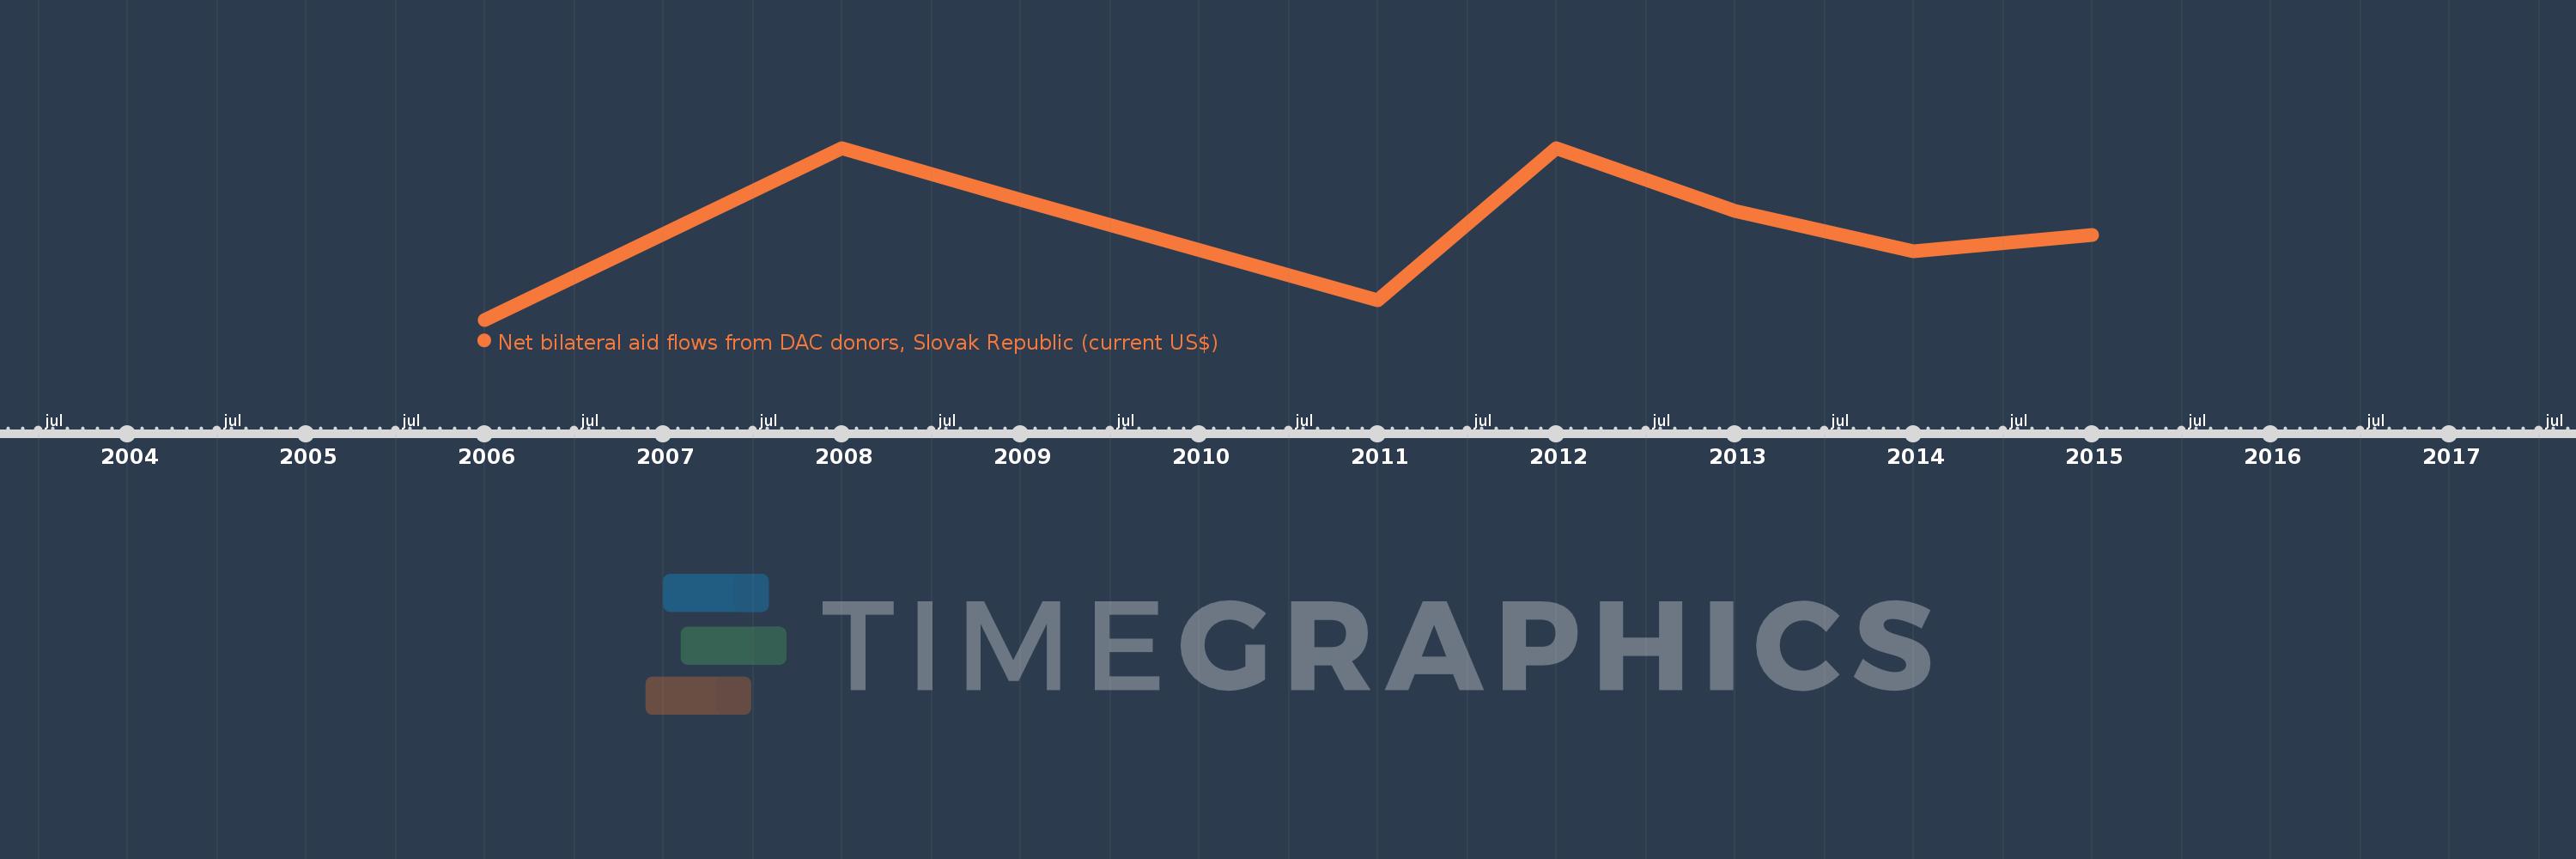
This timeline shows a graph from 2006 to 2015 of Small states. No data until 2005. Number of actual observations by date: 8.
Source name:
World Development Indicators
Source organization:
Development Assistance Committee of the Organisation for Economic Co-operation and Development, Geographical Distribution of Financial Flows to Developing Countries, Development Co-operation Report, and International Development Statistics database. Data are available online at: www.oecd.org/dac/stats/idsonline.
Categories, topics:
Aid Effectiveness
Last updated:
apr 23, 2017
Indicators value changes by year
Meaning:
351.25K
Minimum:
10.0K
jan 1, 2006
Maximum:
640.0K
jan 1, 2008
At the date of observation
Value
Absolute change
Change from the previous value
jan 1, 2006
10.0K
+10.0K
0.0%
jan 1, 2008
640.0K
+630.0K
6.3K%
jan 1, 2009
450.0K
-190.0K
-29.69%
jan 1, 2011
80.0K
-370.0K
-82.22%
jan 1, 2012
640.0K
+560.0K
700.0%
jan 1, 2013
410.0K
-230.0K
-35.94%
jan 1, 2014
260.0K
-150.0K
-36.59%
jan 1, 2015
320.0K
+60.0K
23.08%
Ranking of countries by current statistics by years