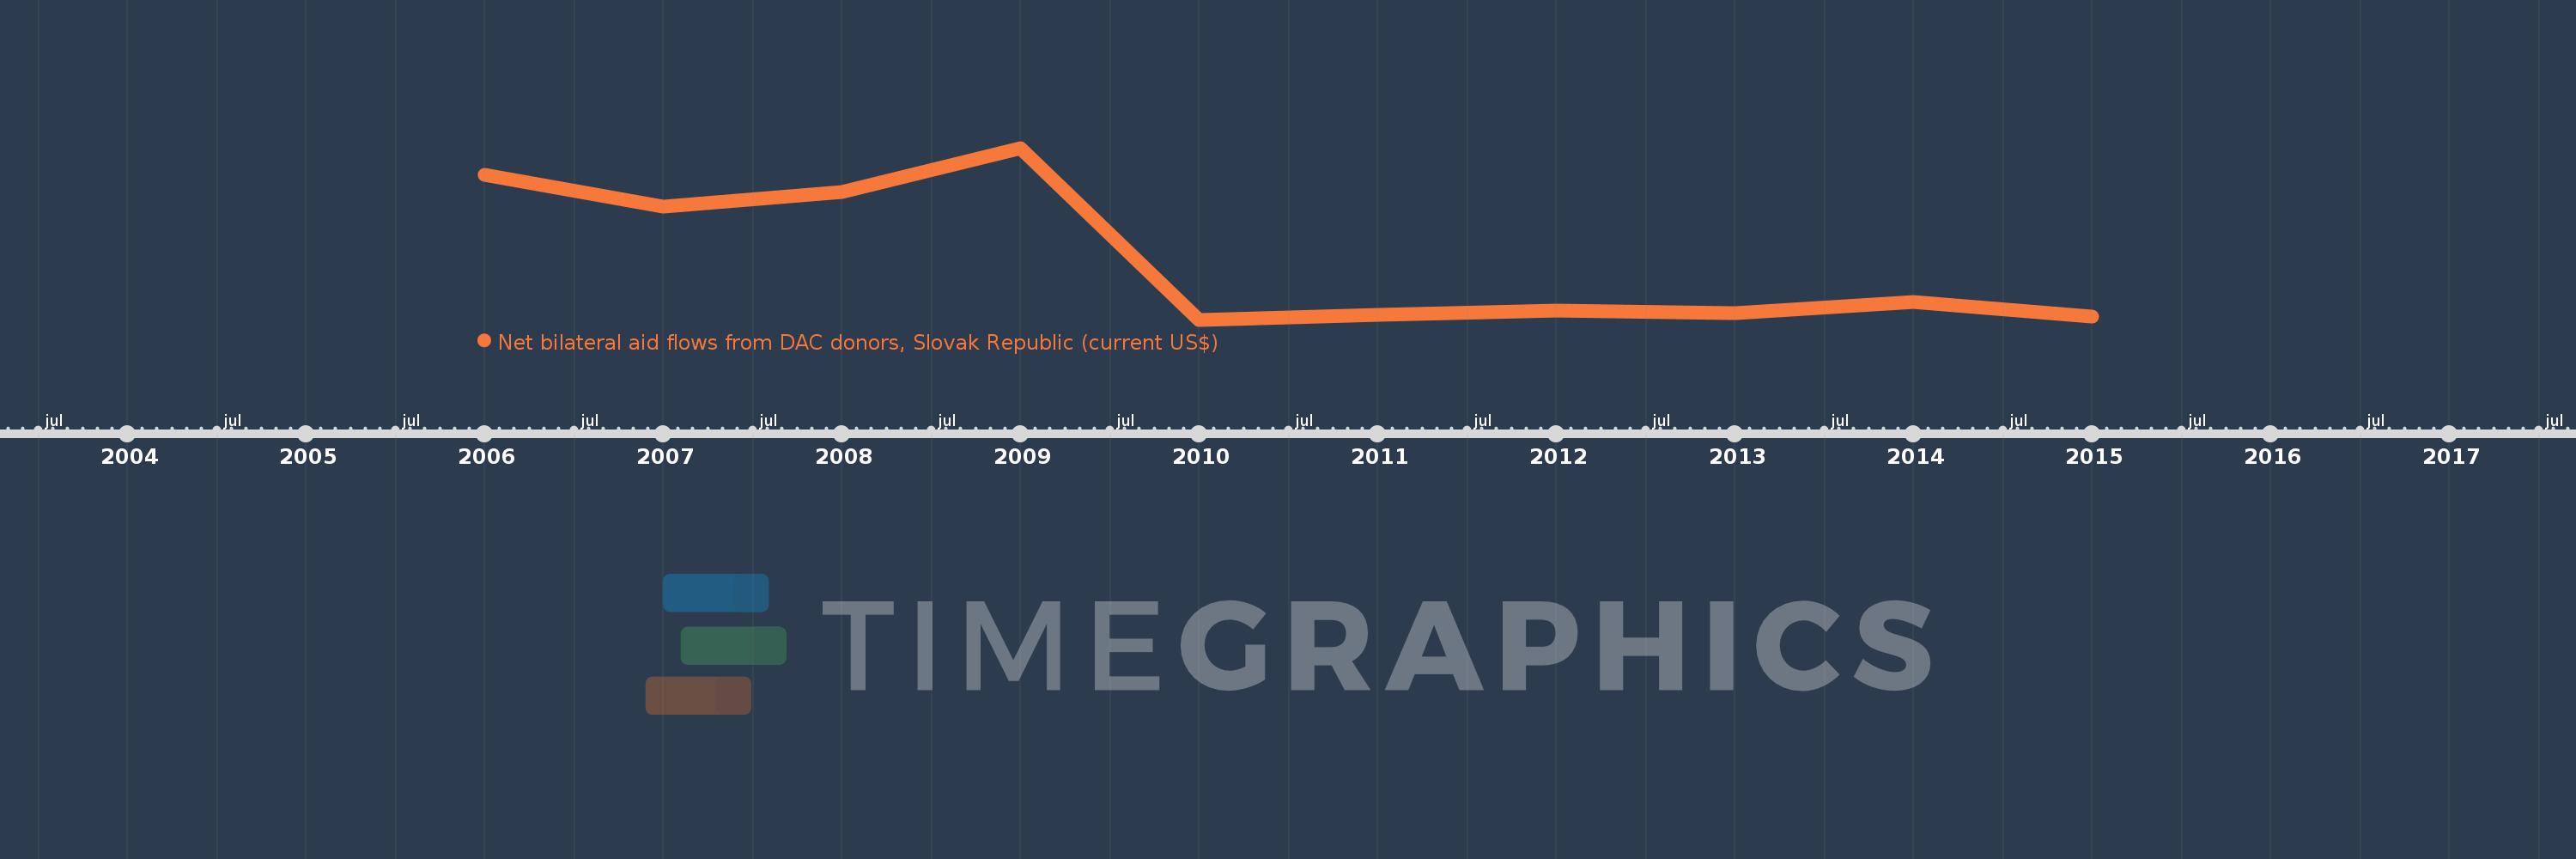
This timeline shows a graph from 2006 to 2015 of Least developed countries: UN classification. No data until 2005. Number of actual observations by date: 10.
Source name:
World Development Indicators
Source organization:
Development Assistance Committee of the Organisation for Economic Co-operation and Development, Geographical Distribution of Financial Flows to Developing Countries, Development Co-operation Report, and International Development Statistics database. Data are available online at: www.oecd.org/dac/stats/idsonline.
Categories, topics:
Aid Effectiveness
Last updated:
apr 23, 2017
Indicators value changes by year
Meaning:
9.441 mln
Minimum:
690.0K
jan 1, 2010
Maximum:
25.77 mln
jan 1, 2009
At the date of observation
Value
Absolute change
Change from the previous value
jan 1, 2006
21.86 mln
+21.86 mln
0.0%
jan 1, 2007
17.17 mln
-4.69 mln
-21.45%
jan 1, 2008
19.3 mln
+2.13 mln
12.41%
jan 1, 2009
25.77 mln
+6.47 mln
33.52%
jan 1, 2010
690.0K
-25.08 mln
-97.32%
jan 1, 2011
1.4 mln
+710.0K
102.9%
jan 1, 2012
2.01 mln
+610.0K
43.57%
jan 1, 2013
1.7 mln
-310.0K
-15.42%
jan 1, 2014
3.34 mln
+1.64 mln
96.47%
jan 1, 2015
1.17 mln
-2.17 mln
-64.97%
Ranking of countries by current statistics by years