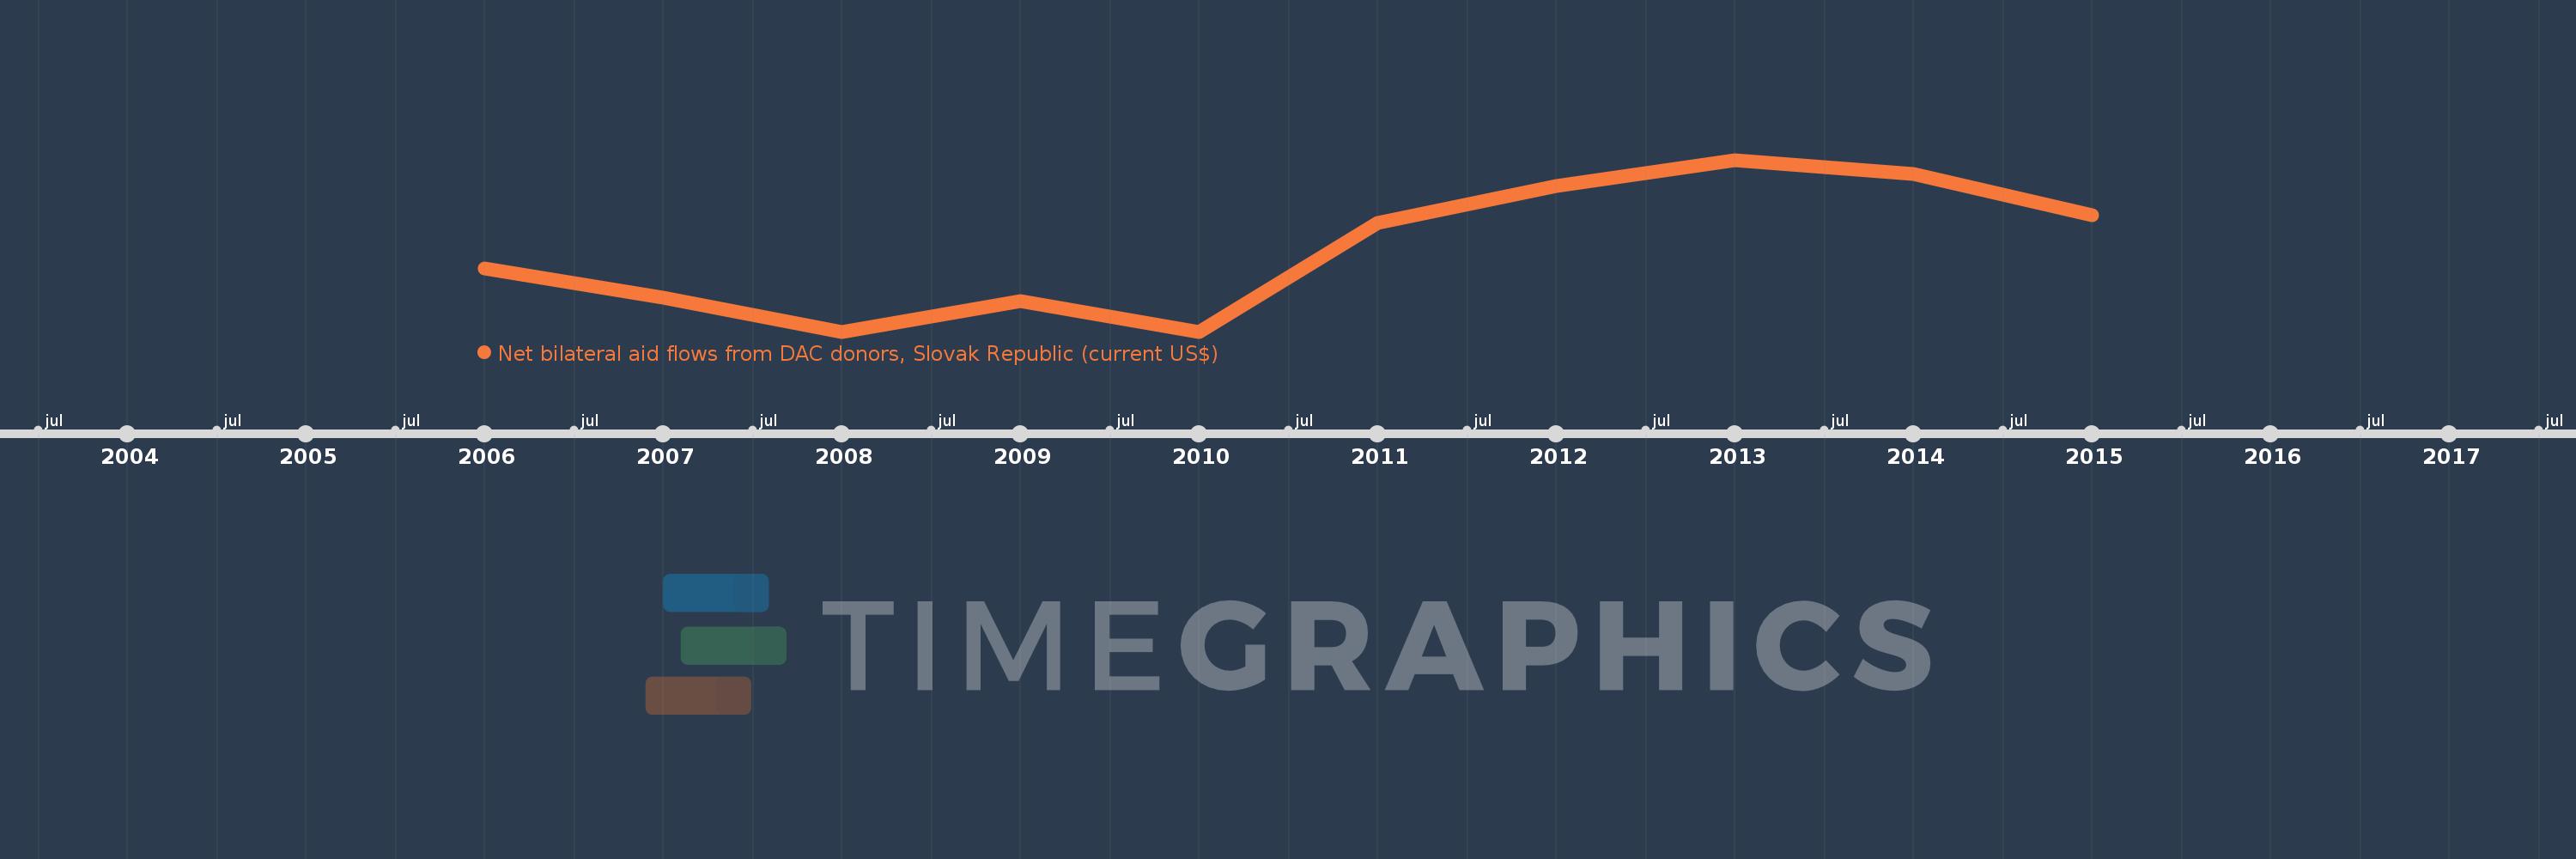
This timeline shows a graph from 2006 to 2015 of Kenya. No data until 2005. Number of actual observations by date: 10.
Source name:
World Development Indicators
Source organization:
Development Assistance Committee of the Organisation for Economic Co-operation and Development, Geographical Distribution of Financial Flows to Developing Countries, Development Co-operation Report, and International Development Statistics database. Data are available online at: www.oecd.org/dac/stats/idsonline.
Categories, topics:
Aid Effectiveness
Last updated:
apr 23, 2017
Indicators value changes by year
Meaning:
884.0K
Minimum:
60.0K
jan 1, 2008
Maximum:
1.77 mln
jan 1, 2013
At the date of observation
Value
Absolute change
Change from the previous value
jan 1, 2006
690.0K
+690.0K
0.0%
jan 1, 2007
400.0K
-290.0K
-42.03%
jan 1, 2008
60.0K
-340.0K
-85.0%
jan 1, 2009
360.0K
+300.0K
500.0%
jan 1, 2010
60.0K
-300.0K
-83.33%
jan 1, 2011
1.14 mln
+1.08 mln
1.8K%
jan 1, 2012
1.51 mln
+370.0K
32.46%
jan 1, 2013
1.77 mln
+260.0K
17.22%
jan 1, 2014
1.63 mln
-140.0K
-7.91%
jan 1, 2015
1.22 mln
-410.0K
-25.15%
Ranking of countries by current statistics by years