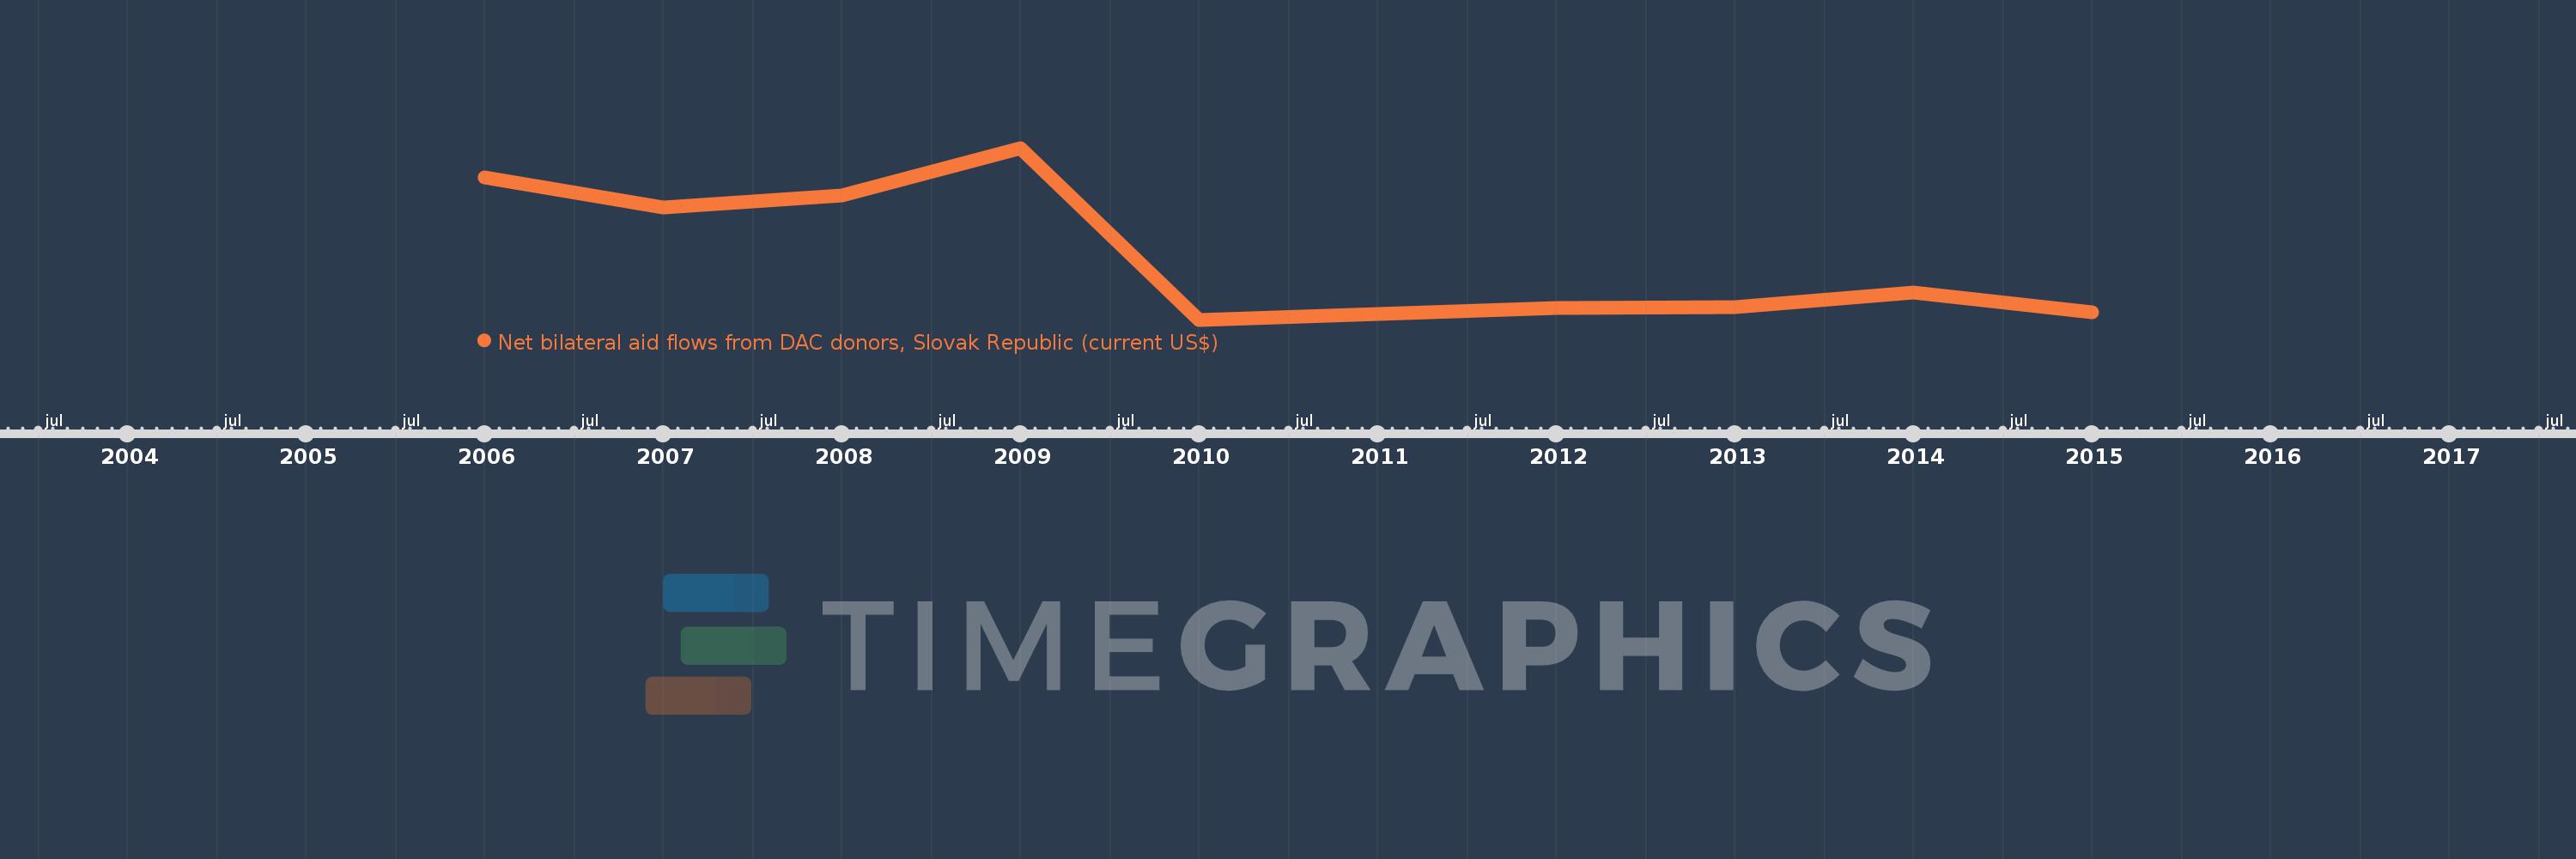
This timeline shows a graph from 2006 to 2015 of IDA only. No data until 2005. Number of actual observations by date: 10.
Source name:
World Development Indicators
Source organization:
Development Assistance Committee of the Organisation for Economic Co-operation and Development, Geographical Distribution of Financial Flows to Developing Countries, Development Co-operation Report, and International Development Statistics database. Data are available online at: www.oecd.org/dac/stats/idsonline.
Categories, topics:
Aid Effectiveness
Last updated:
apr 23, 2017
Indicators value changes by year
Meaning:
10.789 mln
Minimum:
1.85 mln
jan 1, 2010
Maximum:
26.8 mln
jan 1, 2009
At the date of observation
Value
Absolute change
Change from the previous value
jan 1, 2006
22.53 mln
+22.53 mln
0.0%
jan 1, 2007
18.12 mln
-4.41 mln
-19.57%
jan 1, 2008
19.92 mln
+1.8 mln
9.93%
jan 1, 2009
26.8 mln
+6.88 mln
34.54%
jan 1, 2010
1.85 mln
-24.95 mln
-93.1%
jan 1, 2011
2.68 mln
+830.0K
44.86%
jan 1, 2012
3.52 mln
+840.0K
31.34%
jan 1, 2013
3.72 mln
+200.0K
5.68%
jan 1, 2014
5.76 mln
+2.04 mln
54.84%
jan 1, 2015
2.99 mln
-2.77 mln
-48.09%
Ranking of countries by current statistics by years