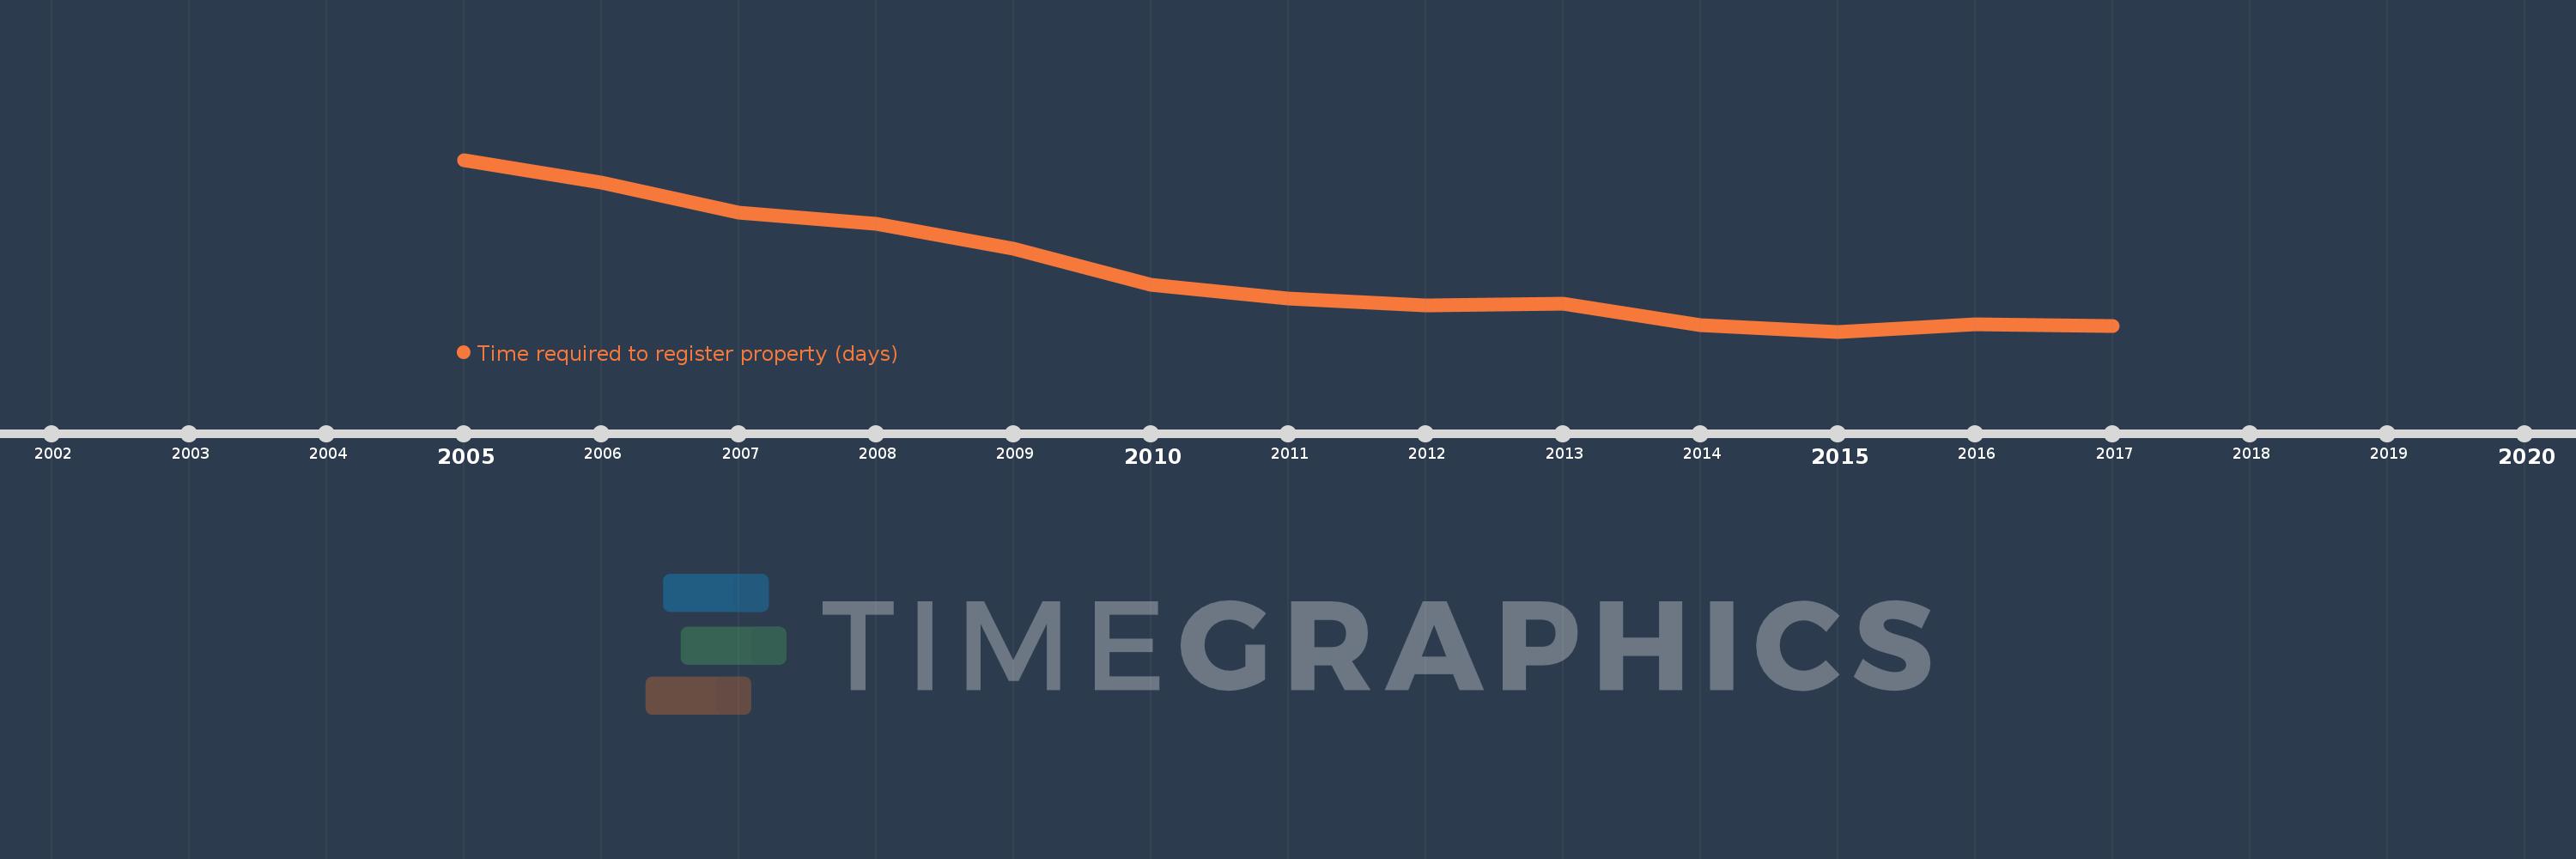
This timeline shows a graph from 2005 to 2017 of Sub-Saharan Africa (IDA & IBRD countries). No data until 2004. Number of actual observations by date: 13.
Source name:
World Development Indicators
Source organization:
World Bank, Doing Business project (http://www.doingbusiness.org/).
Categories, topics:
Private Sector
Last updated:
apr 23, 2017
Indicators value changes by year
Meaning:
76.775
Minimum:
57.906
jan 1, 2015
Maximum:
111.649
jan 1, 2005
At the date of observation
Value
Absolute change
Change from the previous value
jan 1, 2005
111.649
+111.649
0.0%
jan 1, 2006
104.4
-7.249
-6.49%
jan 1, 2007
95.239
-9.161
-8.77%
jan 1, 2008
91.63
-3.609
-3.79%
jan 1, 2009
83.804
-7.826
-8.54%
jan 1, 2010
72.652
-11.152
-13.31%
jan 1, 2011
68.261
-4.391
-6.04%
jan 1, 2012
66.087
-2.174
-3.18%
jan 1, 2013
66.617
+0.53
0.8%
jan 1, 2014
59.864
-6.753
-10.14%
jan 1, 2015
57.906
-1.957
-3.27%
jan 1, 2016
60.242
+2.335
4.03%
jan 1, 2017
59.721
-0.521
-0.86%
Ranking of countries by current statistics by years