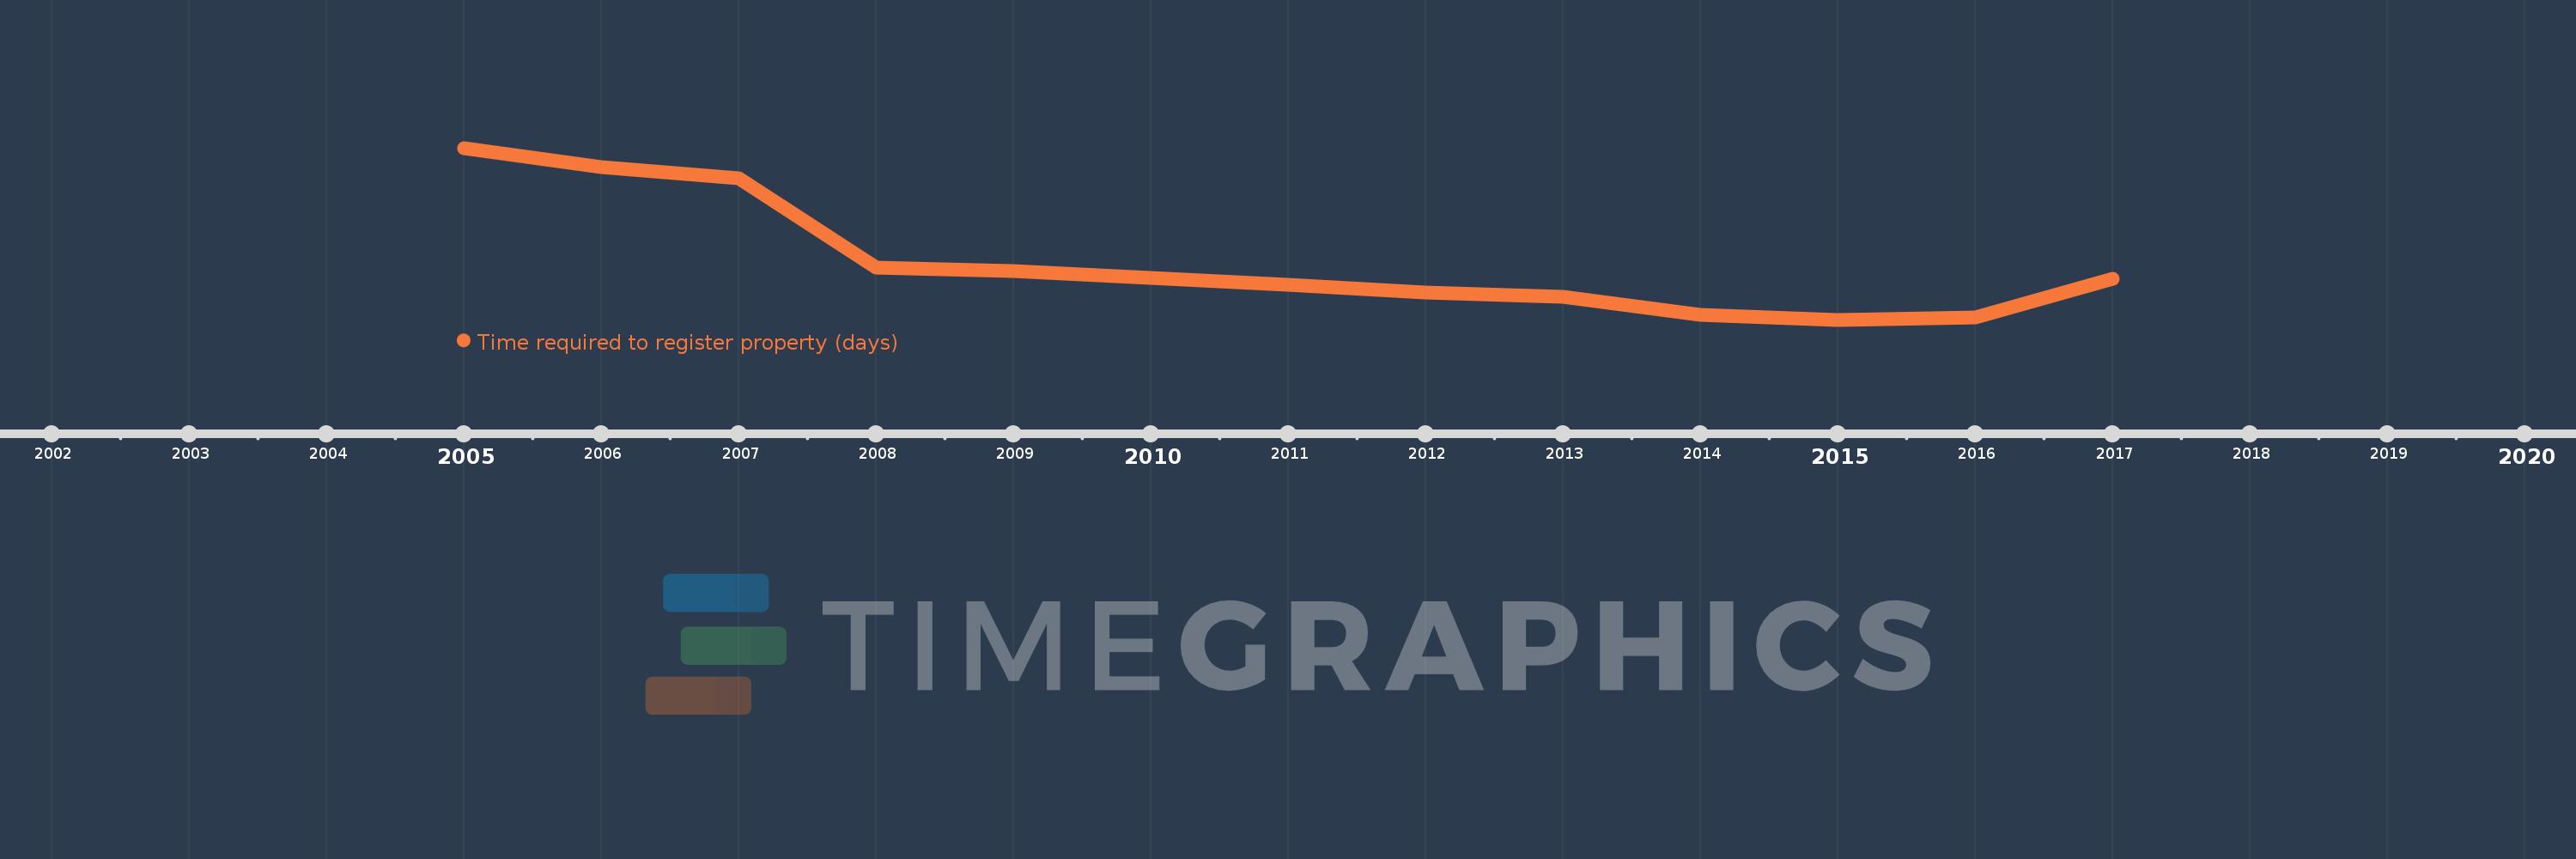
This timeline shows a graph from 2005 to 2017 of Latin America & the Caribbean (IDA & IBRD countries). No data until 2004. Number of actual observations by date: 13.
Source name:
World Development Indicators
Source organization:
World Bank, Doing Business project (http://www.doingbusiness.org/).
Categories, topics:
Private Sector
Last updated:
apr 23, 2017
Indicators value changes by year
Meaning:
62.882
Minimum:
53.167
jan 1, 2015
Maximum:
82.381
jan 1, 2005
At the date of observation
Value
Absolute change
Change from the previous value
jan 1, 2005
82.381
+82.381
0.0%
jan 1, 2006
79.167
-3.214
-3.9%
jan 1, 2007
77.2
-1.967
-2.48%
jan 1, 2008
62.1
-15.1
-19.56%
jan 1, 2009
61.433
-0.667
-1.07%
jan 1, 2010
60.317
-1.117
-1.82%
jan 1, 2011
59.1
-1.217
-2.02%
jan 1, 2012
57.767
-1.333
-2.26%
jan 1, 2013
57.083
-0.683
-1.18%
jan 1, 2014
53.93
-3.153
-5.52%
jan 1, 2015
53.167
-0.763
-1.42%
jan 1, 2016
53.633
+0.467
0.88%
jan 1, 2017
60.183
+6.55
12.21%
Ranking of countries by current statistics by years