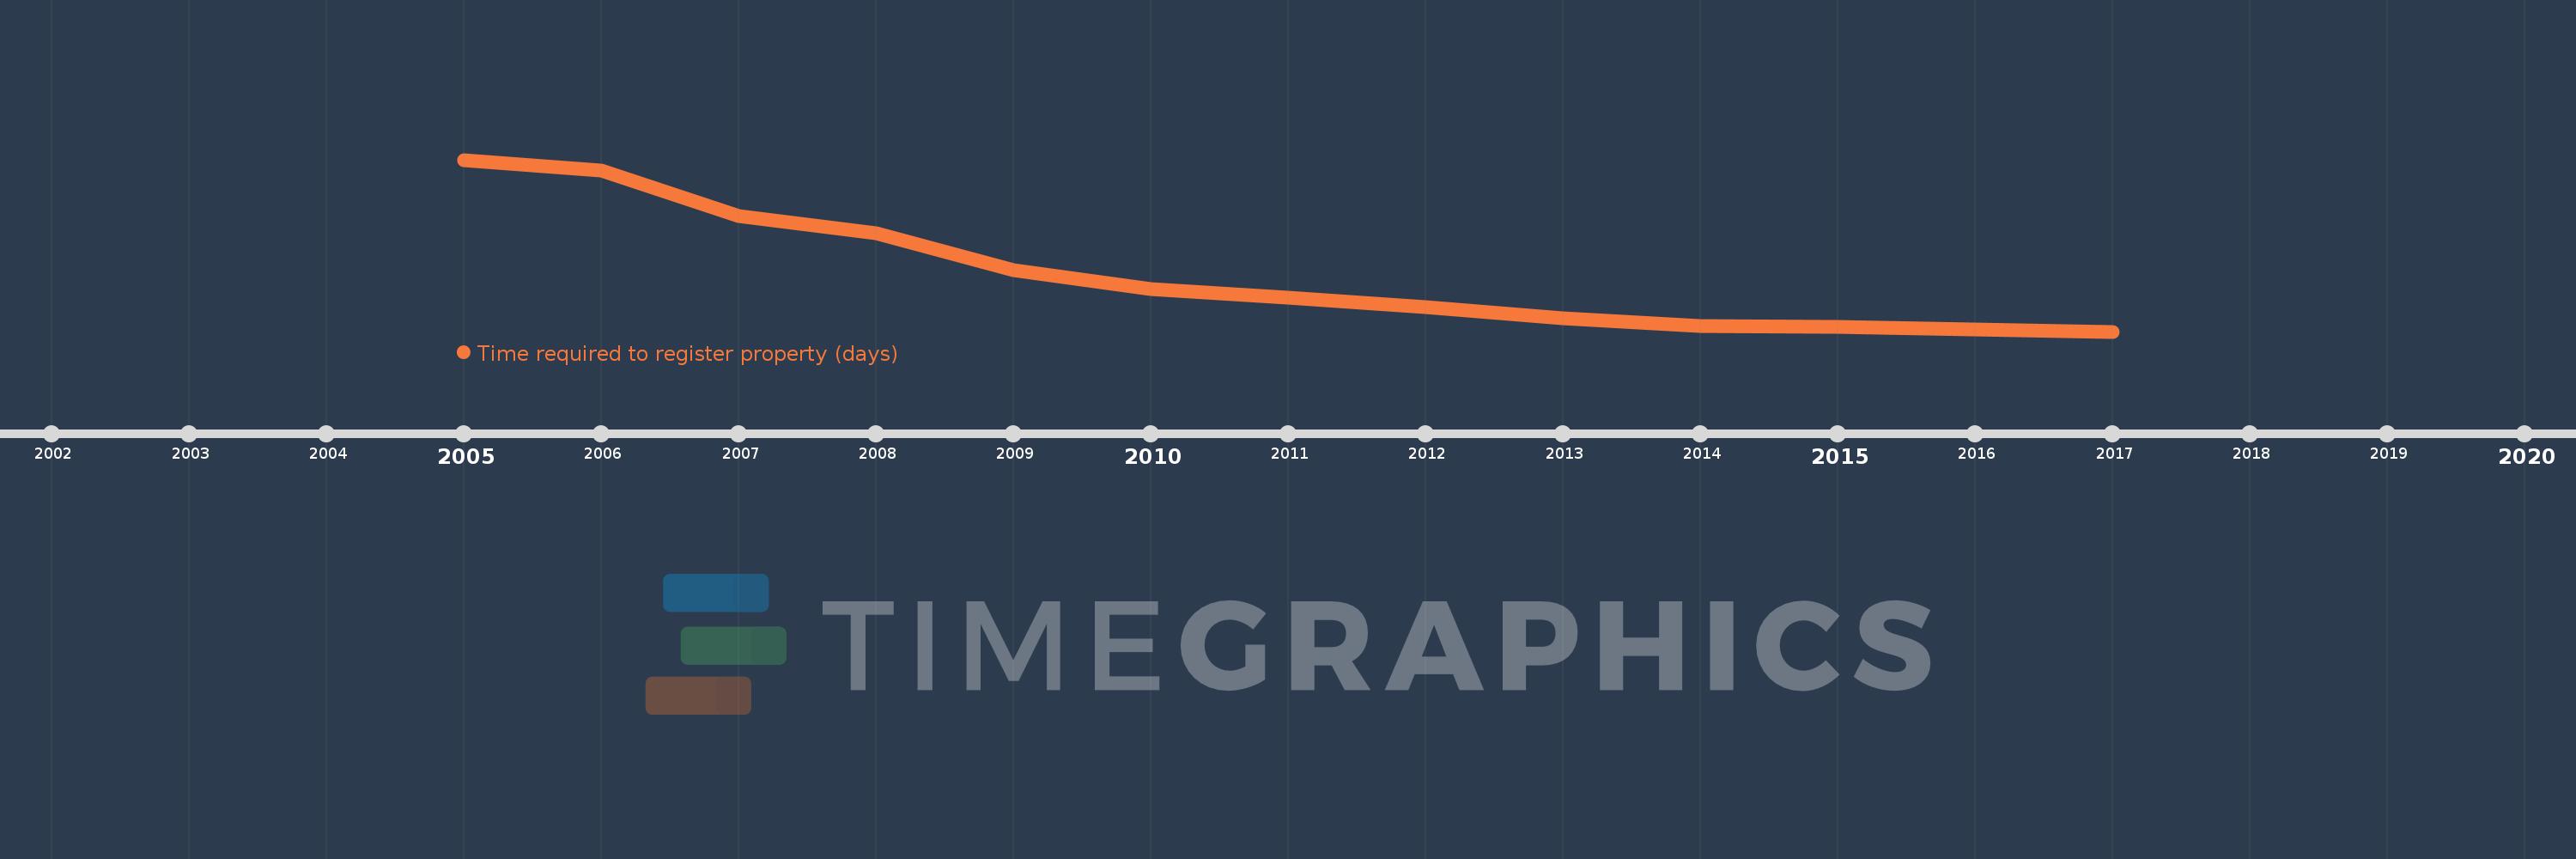
This timeline shows a graph from 2005 to 2017 of Europe & Central Asia (IDA & IBRD countries). No data until 2004. Number of actual observations by date: 13.
Source name:
World Development Indicators
Source organization:
World Bank, Doing Business project (http://www.doingbusiness.org/).
Categories, topics:
Private Sector
Last updated:
apr 23, 2017
Indicators value changes by year
Meaning:
58.129
Minimum:
21.682
jan 1, 2017
Maximum:
132.368
jan 1, 2005
At the date of observation
Value
Absolute change
Change from the previous value
jan 1, 2005
132.368
+132.368
0.0%
jan 1, 2006
125.65
-6.718
-5.08%
jan 1, 2007
96.333
-29.317
-23.33%
jan 1, 2008
84.81
-11.524
-11.96%
jan 1, 2009
61.333
-23.476
-27.68%
jan 1, 2010
48.864
-12.47
-20.33%
jan 1, 2011
43.636
-5.227
-10.7%
jan 1, 2012
37.182
-6.455
-14.79%
jan 1, 2013
30.205
-6.977
-18.77%
jan 1, 2014
25.386
-4.818
-15.95%
jan 1, 2015
24.955
-0.432
-1.7%
jan 1, 2016
23.273
-1.682
-6.74%
jan 1, 2017
21.682
-1.591
-6.84%
Ranking of countries by current statistics by years