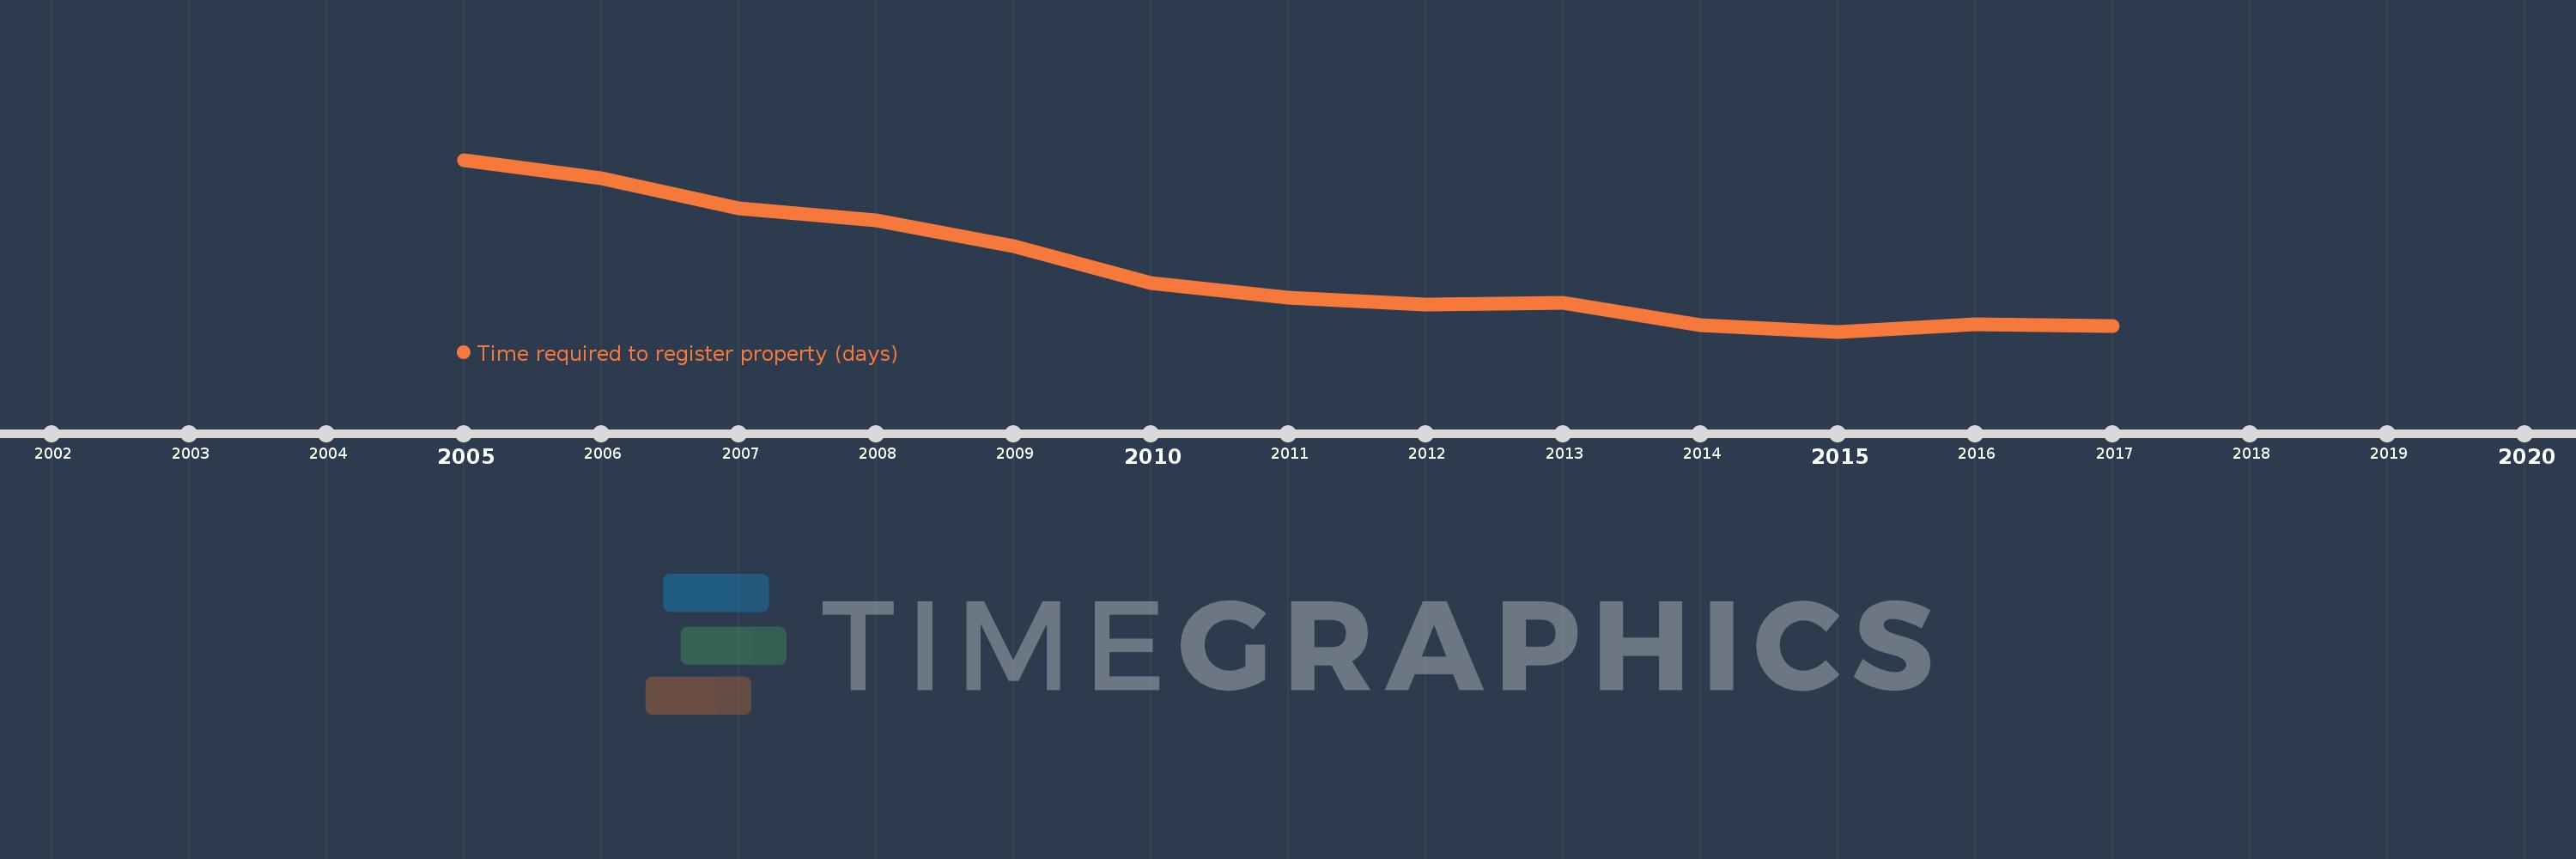
This timeline shows a graph from 2005 to 2017 of Sub-Saharan Africa (excluding high income). No data until 2004. Number of actual observations by date: 13.
Source name:
World Development Indicators
Source organization:
World Bank, Doing Business project (http://www.doingbusiness.org/).
Categories, topics:
Private Sector
Last updated:
apr 23, 2017
Indicators value changes by year
Meaning:
77.609
Minimum:
58.448
jan 1, 2015
Maximum:
111.649
jan 1, 2005
At the date of observation
Value
Absolute change
Change from the previous value
jan 1, 2005
111.649
+111.649
0.0%
jan 1, 2006
106.023
-5.626
-5.04%
jan 1, 2007
96.622
-9.401
-8.87%
jan 1, 2008
92.933
-3.689
-3.82%
jan 1, 2009
84.933
-8.0
-8.61%
jan 1, 2010
73.533
-11.4
-13.42%
jan 1, 2011
69.044
-4.489
-6.1%
jan 1, 2012
66.822
-2.222
-3.22%
jan 1, 2013
67.348
+0.526
0.79%
jan 1, 2014
60.448
-6.9
-10.25%
jan 1, 2015
58.448
-2.0
-3.31%
jan 1, 2016
60.821
+2.373
4.06%
jan 1, 2017
60.289
-0.532
-0.87%
Ranking of countries by current statistics by years