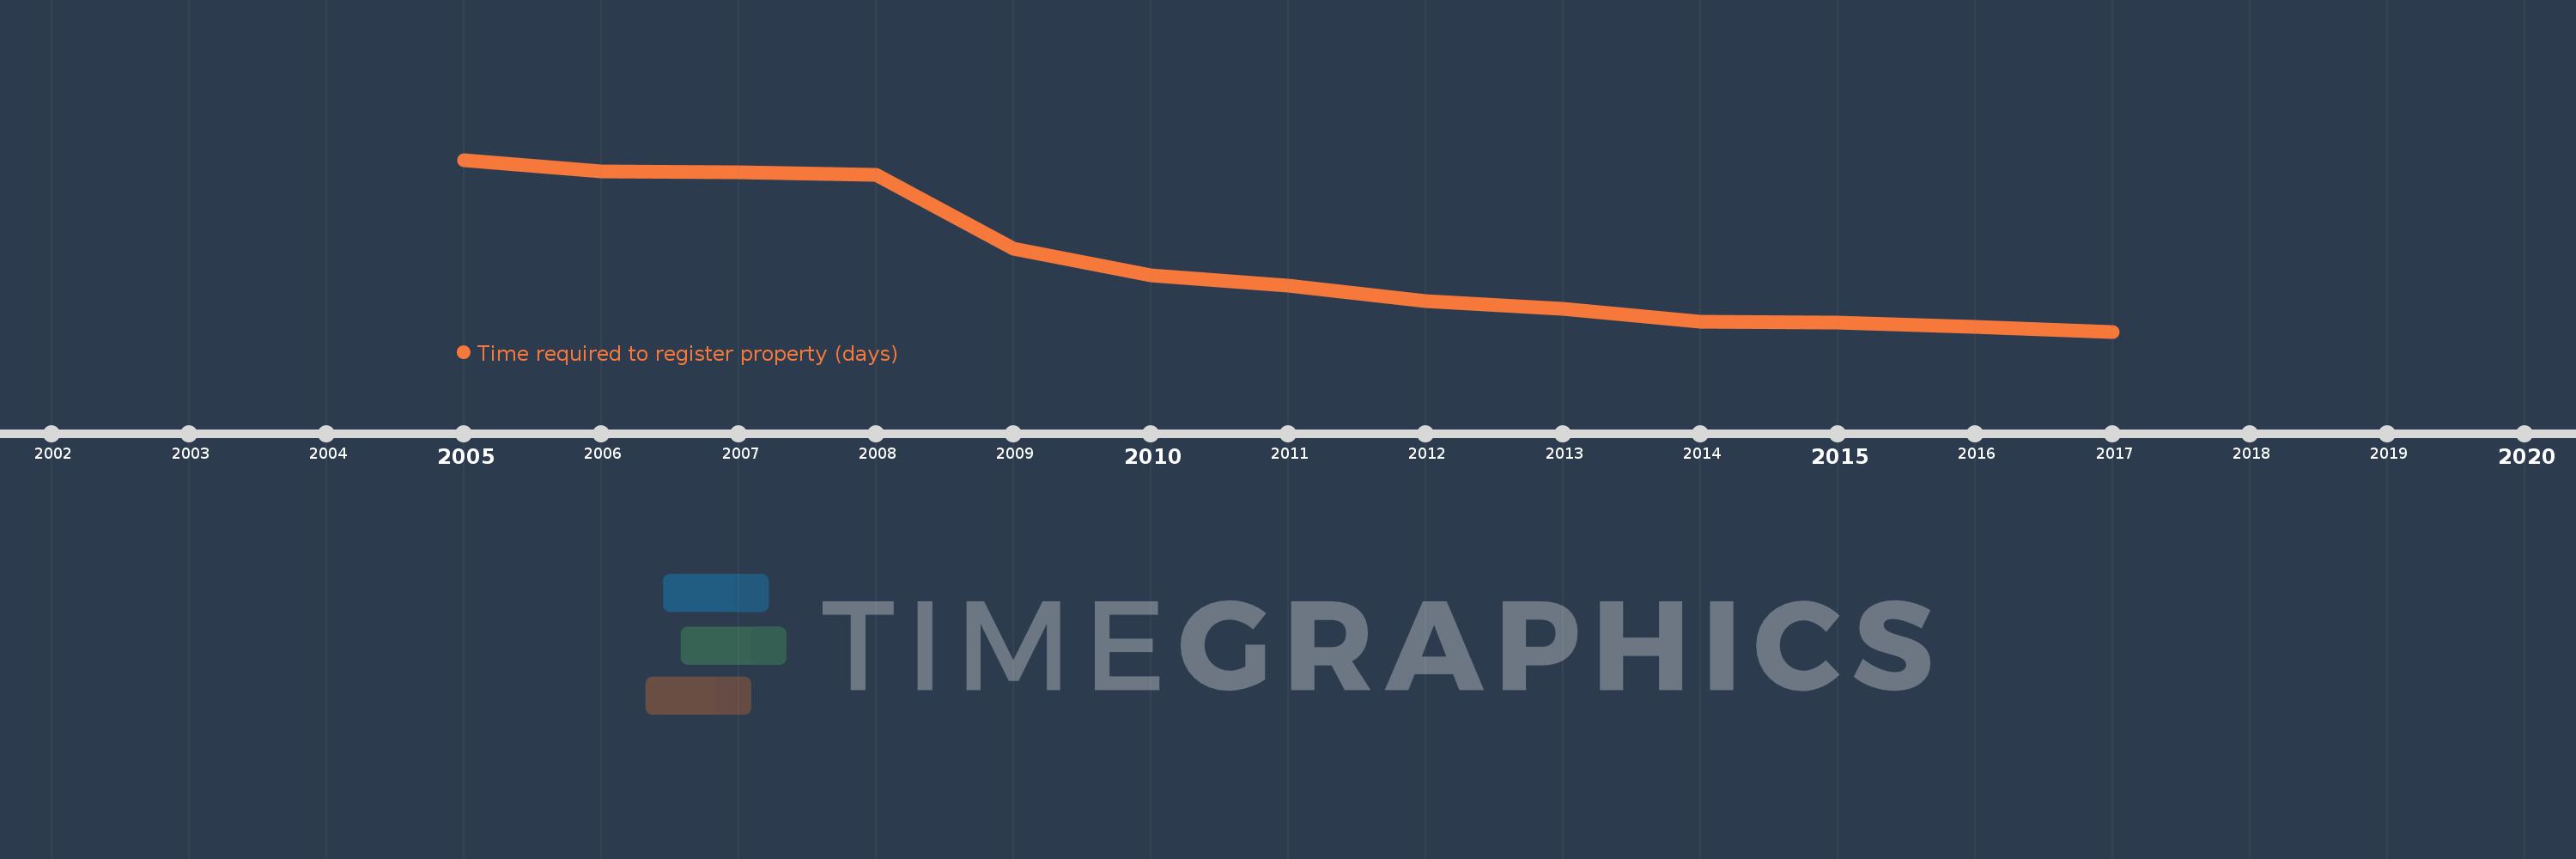
This timeline shows a graph from 2005 to 2017 of Europe & Central Asia (excluding high income). No data until 2004. Number of actual observations by date: 13.
Source name:
World Development Indicators
Source organization:
World Bank, Doing Business project (http://www.doingbusiness.org/).
Categories, topics:
Private Sector
Last updated:
apr 23, 2017
Indicators value changes by year
Meaning:
43.79
Minimum:
19.1
jan 1, 2017
Maximum:
79.706
jan 1, 2005
At the date of observation
Value
Absolute change
Change from the previous value
jan 1, 2005
79.706
+79.706
0.0%
jan 1, 2006
75.667
-4.039
-5.07%
jan 1, 2007
75.263
-0.404
-0.53%
jan 1, 2008
74.368
-0.895
-1.19%
jan 1, 2009
48.421
-25.947
-34.89%
jan 1, 2010
38.85
-9.571
-19.77%
jan 1, 2011
35.35
-3.5
-9.01%
jan 1, 2012
29.8
-5.55
-15.7%
jan 1, 2013
27.025
-2.775
-9.31%
jan 1, 2014
22.675
-4.35
-16.1%
jan 1, 2015
22.2
-0.475
-2.09%
jan 1, 2016
20.85
-1.35
-6.08%
jan 1, 2017
19.1
-1.75
-8.39%
Ranking of countries by current statistics by years