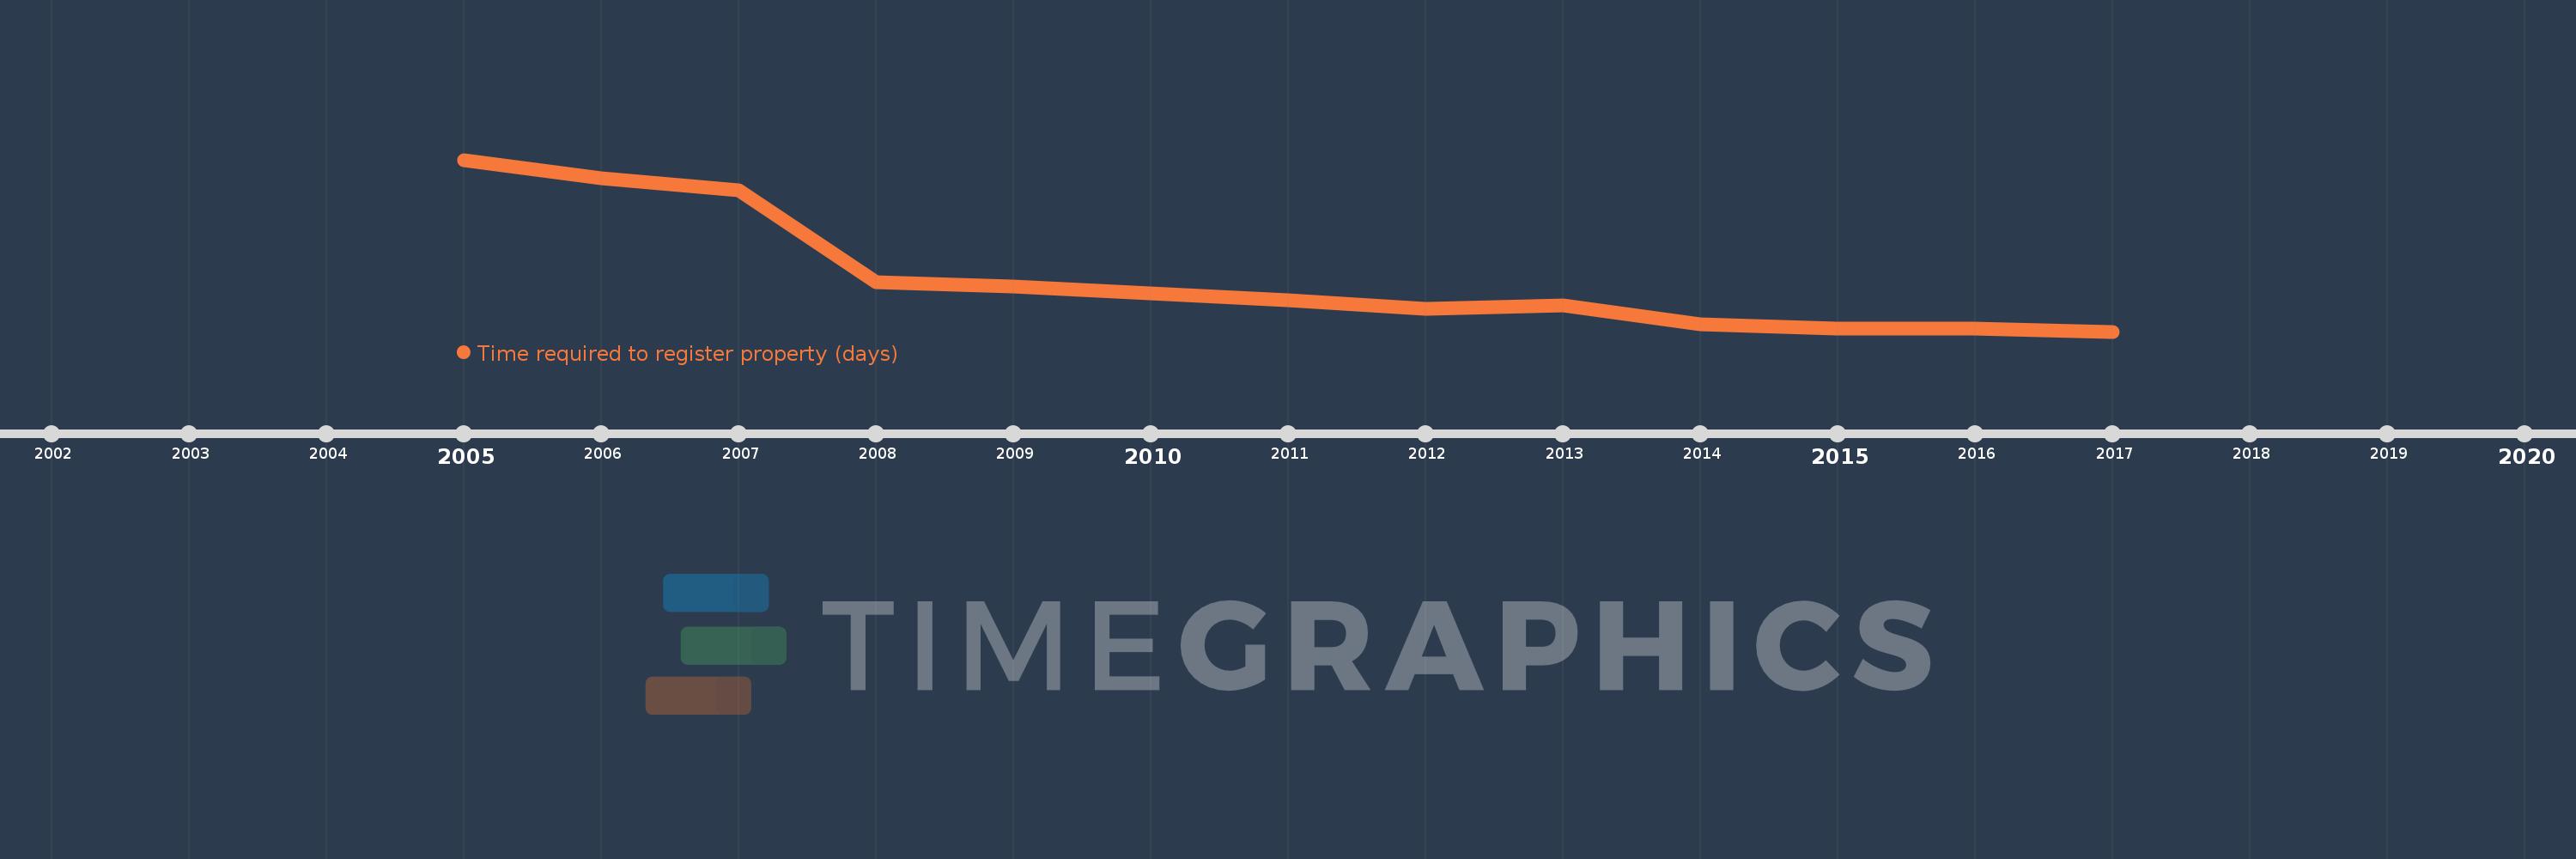
This timeline shows a graph from 2005 to 2017 of Latin America & Caribbean (excluding high income). No data until 2004. Number of actual observations by date: 13.
Source name:
World Development Indicators
Source organization:
World Bank, Doing Business project (http://www.doingbusiness.org/).
Categories, topics:
Private Sector
Last updated:
apr 23, 2017
Indicators value changes by year
Meaning:
62.609
Minimum:
52.08
jan 1, 2017
Maximum:
85.947
jan 1, 2005
At the date of observation
Value
Absolute change
Change from the previous value
jan 1, 2005
85.947
+85.947
0.0%
jan 1, 2006
82.32
-3.627
-4.22%
jan 1, 2007
79.96
-2.36
-2.87%
jan 1, 2008
61.84
-18.12
-22.66%
jan 1, 2009
61.04
-0.8
-1.29%
jan 1, 2010
59.7
-1.34
-2.2%
jan 1, 2011
58.24
-1.46
-2.45%
jan 1, 2012
56.64
-1.6
-2.75%
jan 1, 2013
57.26
+0.62
1.09%
jan 1, 2014
53.576
-3.684
-6.43%
jan 1, 2015
52.66
-0.916
-1.71%
jan 1, 2016
52.66
0.0
0.0%
jan 1, 2017
52.08
-0.58
-1.1%
Ranking of countries by current statistics by years