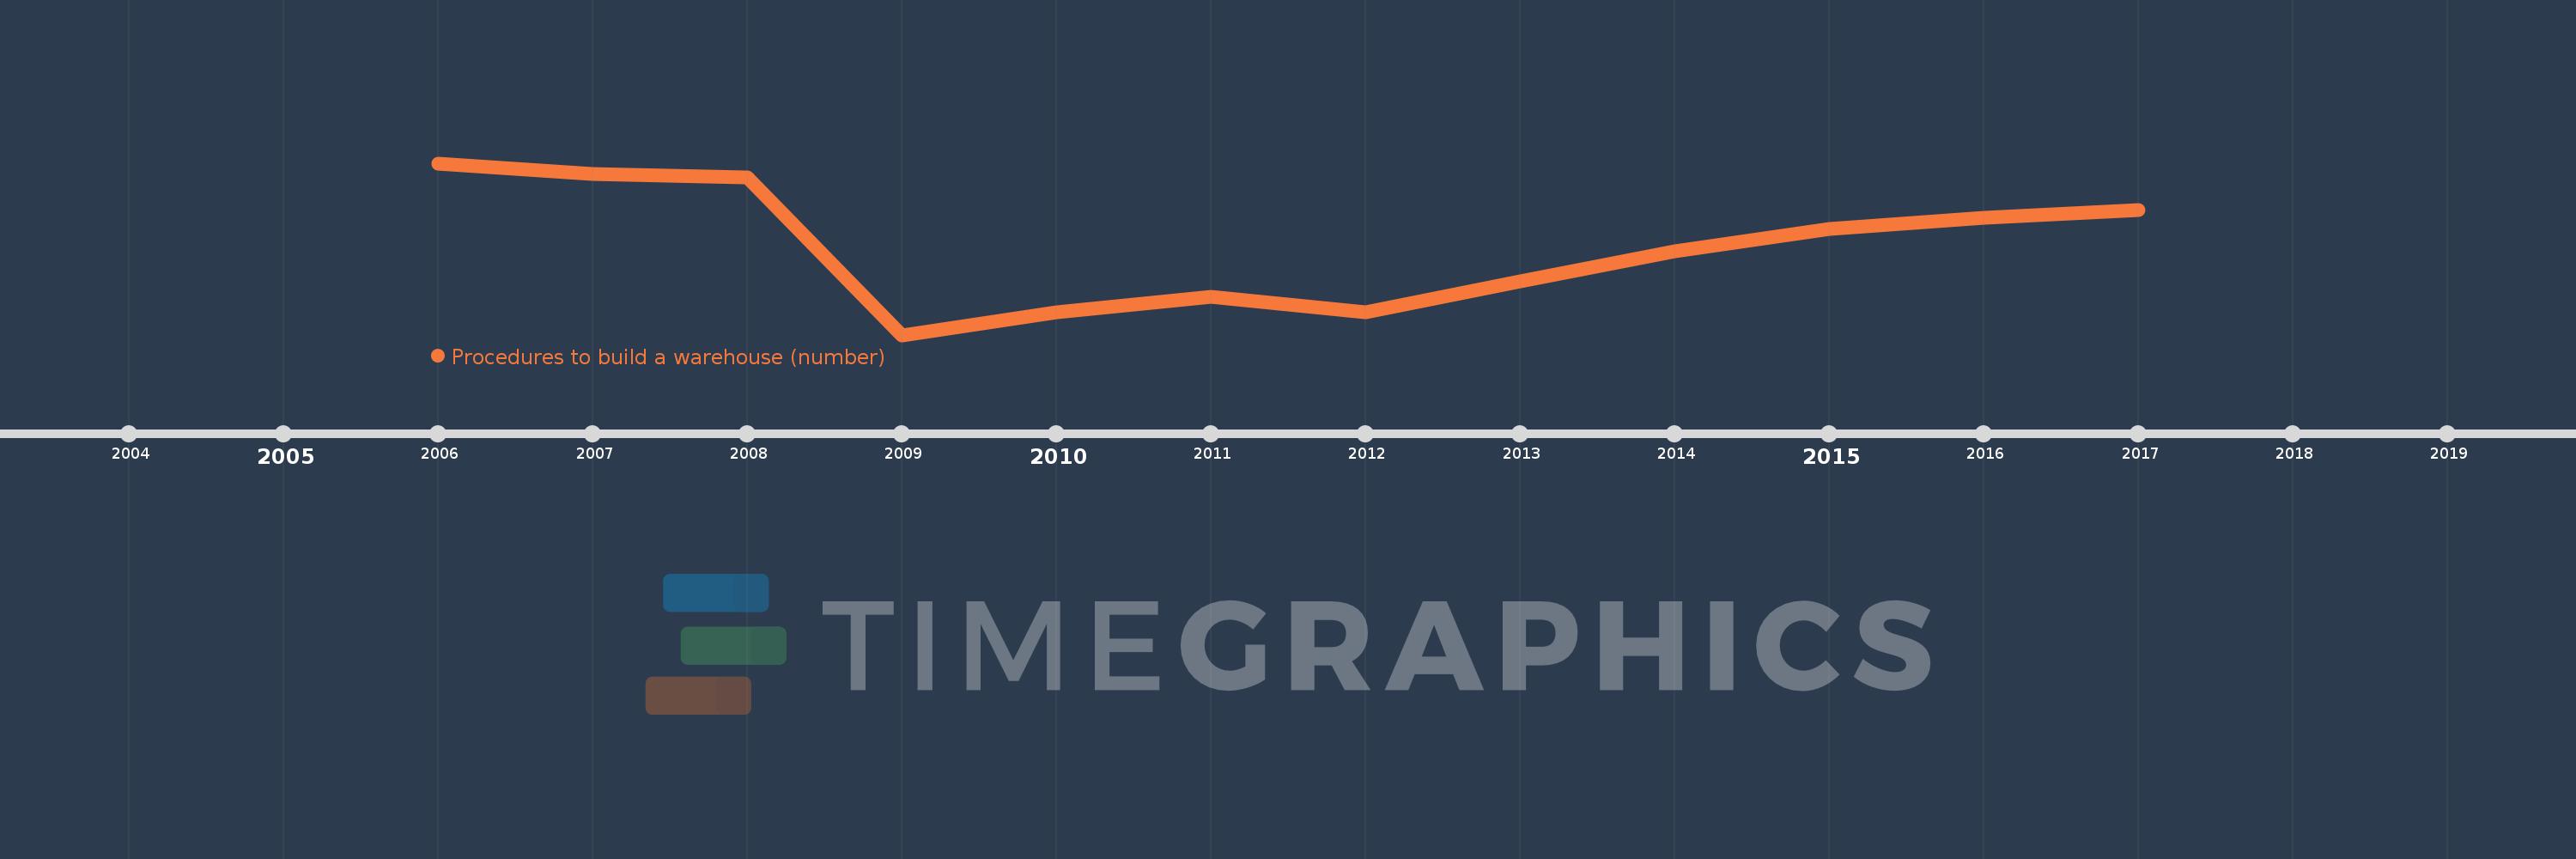
This timeline shows a graph from 2006 to 2017 of Sub-Saharan Africa (IDA & IBRD countries). No data until 2005. Number of actual observations by date: 12.
Source name:
World Development Indicators
Source organization:
World Bank, Doing Business project (http://www.doingbusiness.org/).
Categories, topics:
Private Sector
Last updated:
apr 23, 2017
Indicators value changes by year
Meaning:
14.312
Minimum:
13.8
jan 1, 2009
Maximum:
14.795
jan 1, 2006
At the date of observation
Value
Absolute change
Change from the previous value
jan 1, 2006
14.795
+14.795
0.0%
jan 1, 2007
14.733
-0.062
-0.42%
jan 1, 2008
14.711
-0.022
-0.15%
jan 1, 2009
13.8
-0.911
-6.19%
jan 1, 2010
13.933
+0.133
0.97%
jan 1, 2011
14.022
+0.089
0.64%
jan 1, 2012
13.933
-0.089
-0.63%
jan 1, 2013
14.109
+0.175
1.26%
jan 1, 2014
14.285
+0.176
1.25%
jan 1, 2015
14.415
+0.13
0.91%
jan 1, 2016
14.48
+0.065
0.45%
jan 1, 2017
14.524
+0.043
0.3%
Ranking of countries by current statistics by years