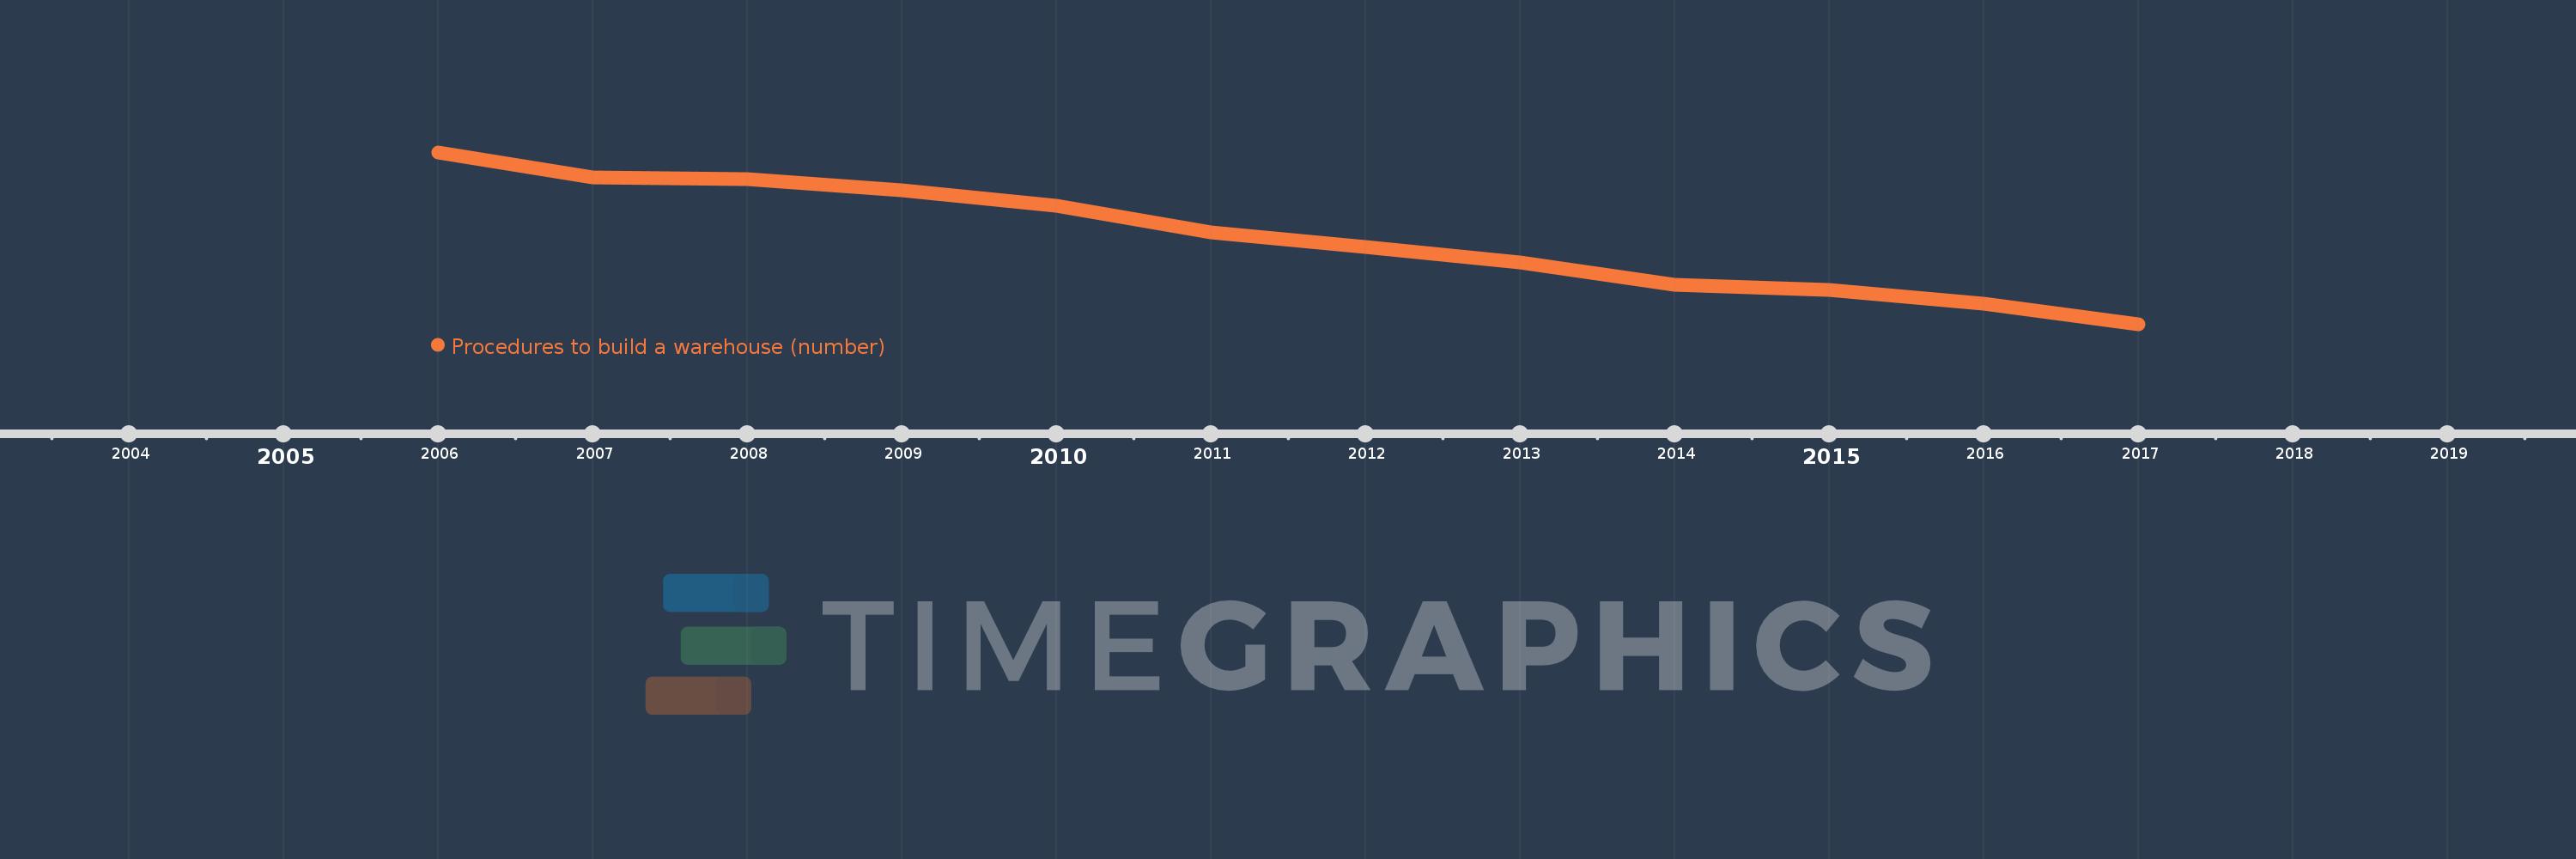
This timeline shows a graph from 2006 to 2017 of Europe & Central Asia (IDA & IBRD countries). No data until 2005. Number of actual observations by date: 12.
Source name:
World Development Indicators
Source organization:
World Bank, Doing Business project (http://www.doingbusiness.org/).
Categories, topics:
Private Sector
Last updated:
apr 23, 2017
Indicators value changes by year
Meaning:
19.473
Minimum:
15.623
jan 1, 2017
Maximum:
23.25
jan 1, 2006
At the date of observation
Value
Absolute change
Change from the previous value
jan 1, 2006
23.25
+23.25
0.0%
jan 1, 2007
22.143
-1.107
-4.76%
jan 1, 2008
22.048
-0.095
-0.43%
jan 1, 2009
21.571
-0.476
-2.16%
jan 1, 2010
20.864
-0.708
-3.28%
jan 1, 2011
19.682
-1.182
-5.66%
jan 1, 2012
19.048
-0.634
-3.22%
jan 1, 2013
18.381
-0.667
-3.5%
jan 1, 2014
17.376
-1.005
-5.47%
jan 1, 2015
17.15
-0.226
-1.3%
jan 1, 2016
16.538
-0.612
-3.57%
jan 1, 2017
15.623
-0.915
-5.53%
Ranking of countries by current statistics by years