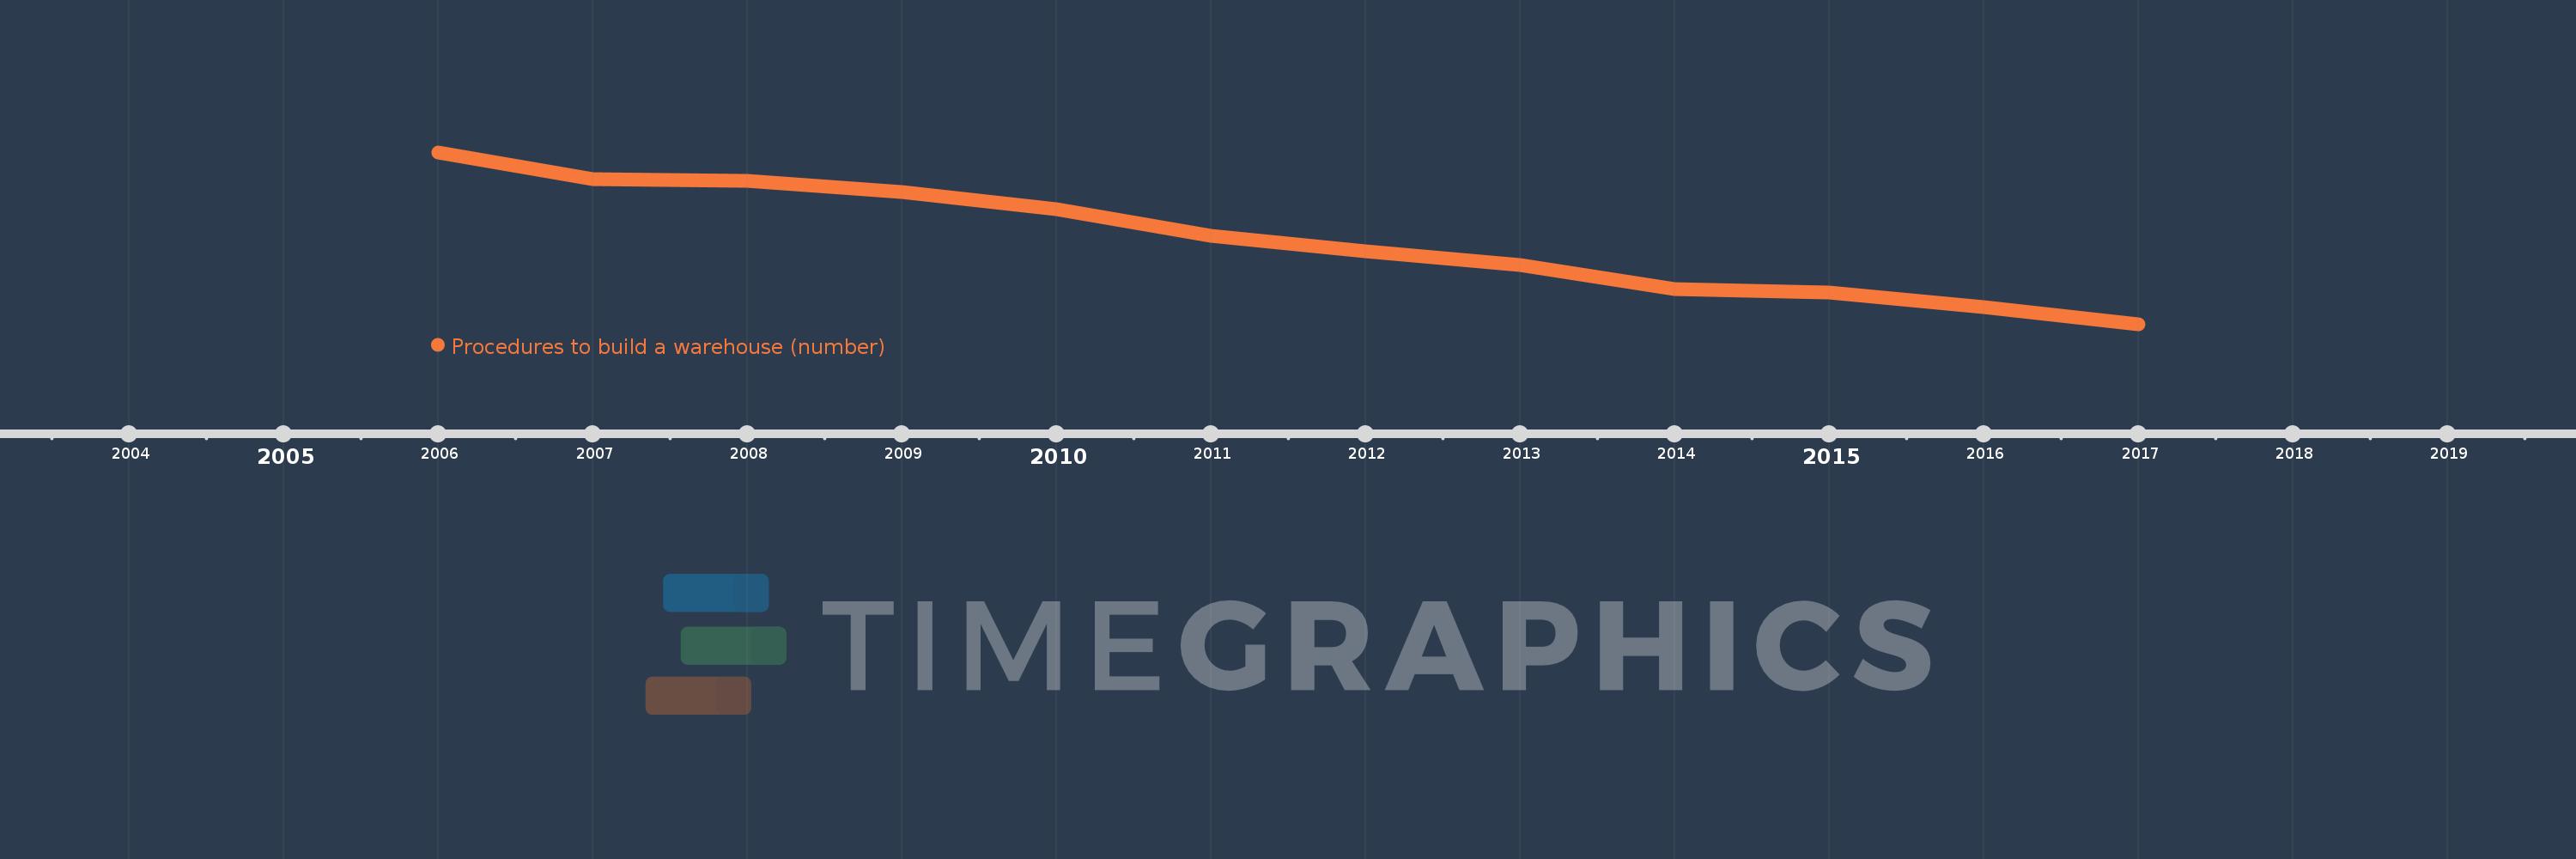
This timeline shows a graph from 2006 to 2017 of Europe & Central Asia (excluding high income). No data until 2005. Number of actual observations by date: 12.
Source name:
World Development Indicators
Source organization:
World Bank, Doing Business project (http://www.doingbusiness.org/).
Categories, topics:
Private Sector
Last updated:
apr 23, 2017
Indicators value changes by year
Meaning:
19.528
Minimum:
15.635
jan 1, 2017
Maximum:
23.556
jan 1, 2006
At the date of observation
Value
Absolute change
Change from the previous value
jan 1, 2006
23.556
+23.556
0.0%
jan 1, 2007
22.316
-1.24
-5.26%
jan 1, 2008
22.263
-0.053
-0.24%
jan 1, 2009
21.737
-0.526
-2.36%
jan 1, 2010
20.95
-0.787
-3.62%
jan 1, 2011
19.7
-1.25
-5.97%
jan 1, 2012
19.0
-0.7
-3.55%
jan 1, 2013
18.368
-0.632
-3.32%
jan 1, 2014
17.258
-1.111
-6.05%
jan 1, 2015
17.115
-0.143
-0.83%
jan 1, 2016
16.437
-0.678
-3.96%
jan 1, 2017
15.635
-0.802
-4.88%
Ranking of countries by current statistics by years