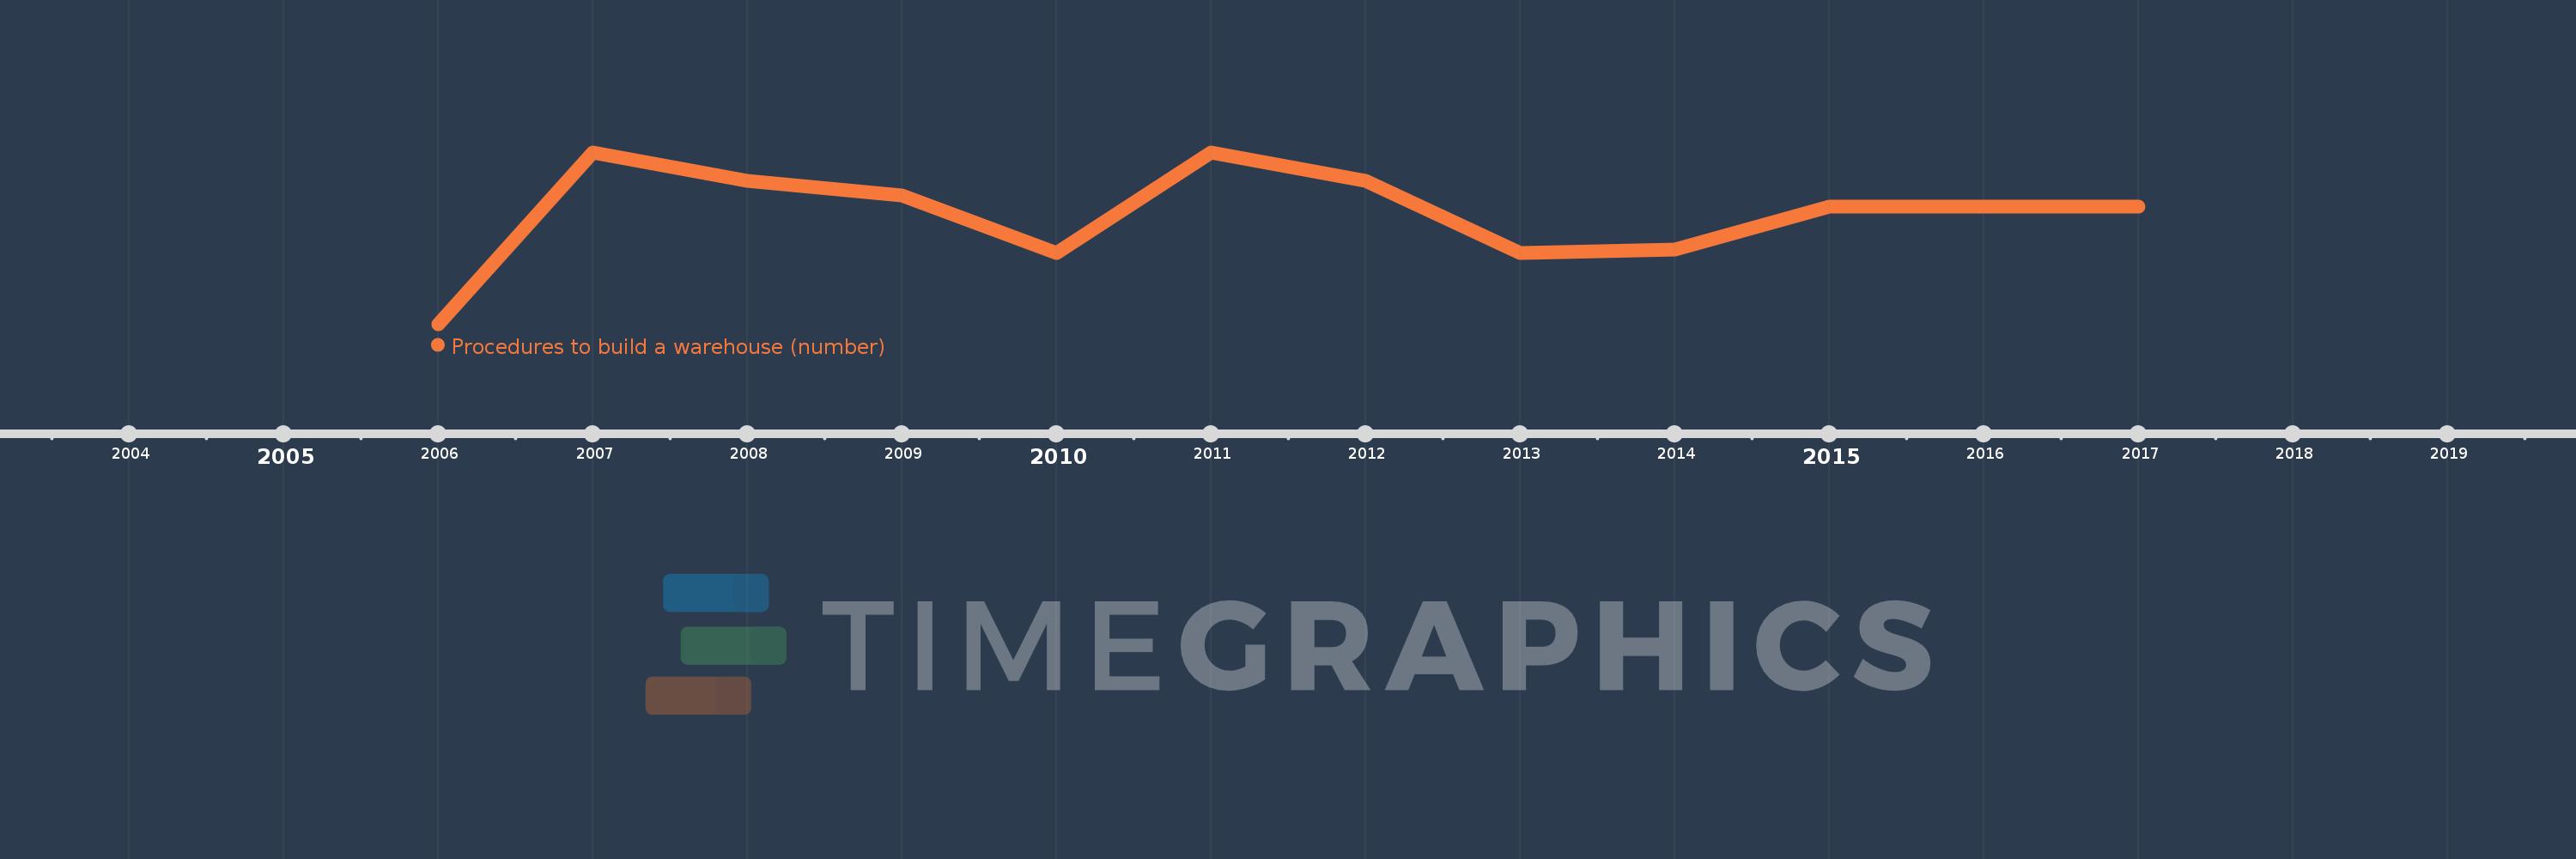
This timeline shows a graph from 2006 to 2017 of Latin America & the Caribbean (IDA & IBRD countries). No data until 2005. Number of actual observations by date: 12.
Source name:
World Development Indicators
Source organization:
World Bank, Doing Business project (http://www.doingbusiness.org/).
Categories, topics:
Private Sector
Last updated:
apr 23, 2017
Indicators value changes by year
Meaning:
14.324
Minimum:
14.067
jan 1, 2006
Maximum:
14.467
jan 1, 2007
At the date of observation
Value
Absolute change
Change from the previous value
jan 1, 2006
14.067
+14.067
0.0%
jan 1, 2007
14.467
+0.4
2.84%
jan 1, 2008
14.4
-0.067
-0.46%
jan 1, 2009
14.367
-0.033
-0.23%
jan 1, 2010
14.233
-0.133
-0.93%
jan 1, 2011
14.467
+0.233
1.64%
jan 1, 2012
14.4
-0.067
-0.46%
jan 1, 2013
14.233
-0.167
-1.16%
jan 1, 2014
14.24
+0.007
0.05%
jan 1, 2015
14.34
+0.1
0.7%
jan 1, 2016
14.34
0.0
0.0%
jan 1, 2017
14.34
0.0
0.0%
Ranking of countries by current statistics by years