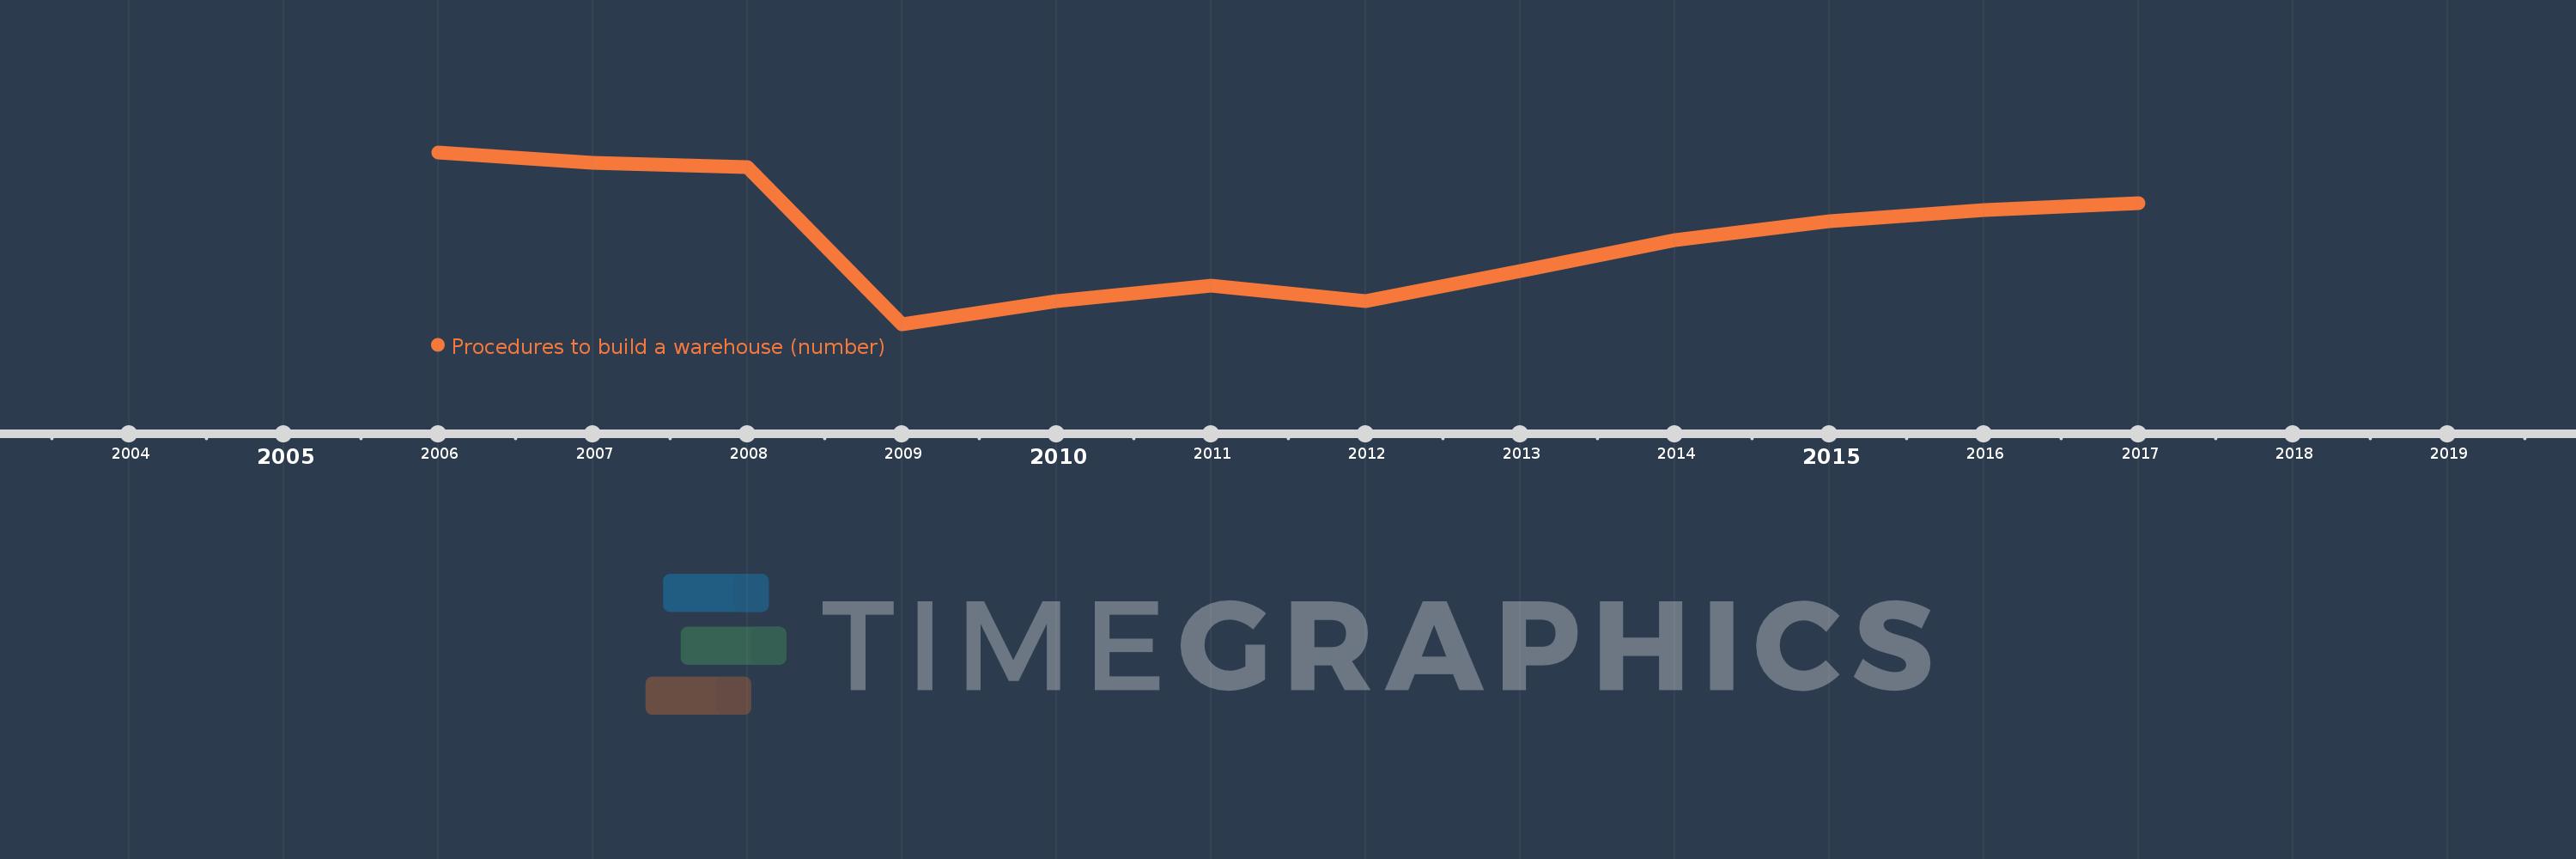
This timeline shows a graph from 2006 to 2017 of Sub-Saharan Africa (excluding high income). No data until 2005. Number of actual observations by date: 12.
Source name:
World Development Indicators
Source organization:
World Bank, Doing Business project (http://www.doingbusiness.org/).
Categories, topics:
Private Sector
Last updated:
apr 23, 2017
Indicators value changes by year
Meaning:
14.268
Minimum:
13.75
jan 1, 2009
Maximum:
14.767
jan 1, 2006
At the date of observation
Value
Absolute change
Change from the previous value
jan 1, 2006
14.767
+14.767
0.0%
jan 1, 2007
14.705
-0.063
-0.43%
jan 1, 2008
14.682
-0.023
-0.15%
jan 1, 2009
13.75
-0.932
-6.35%
jan 1, 2010
13.886
+0.136
0.99%
jan 1, 2011
13.977
+0.091
0.65%
jan 1, 2012
13.886
-0.091
-0.65%
jan 1, 2013
14.067
+0.18
1.3%
jan 1, 2014
14.247
+0.18
1.28%
jan 1, 2015
14.358
+0.111
0.78%
jan 1, 2016
14.424
+0.067
0.46%
jan 1, 2017
14.469
+0.044
0.31%
Ranking of countries by current statistics by years