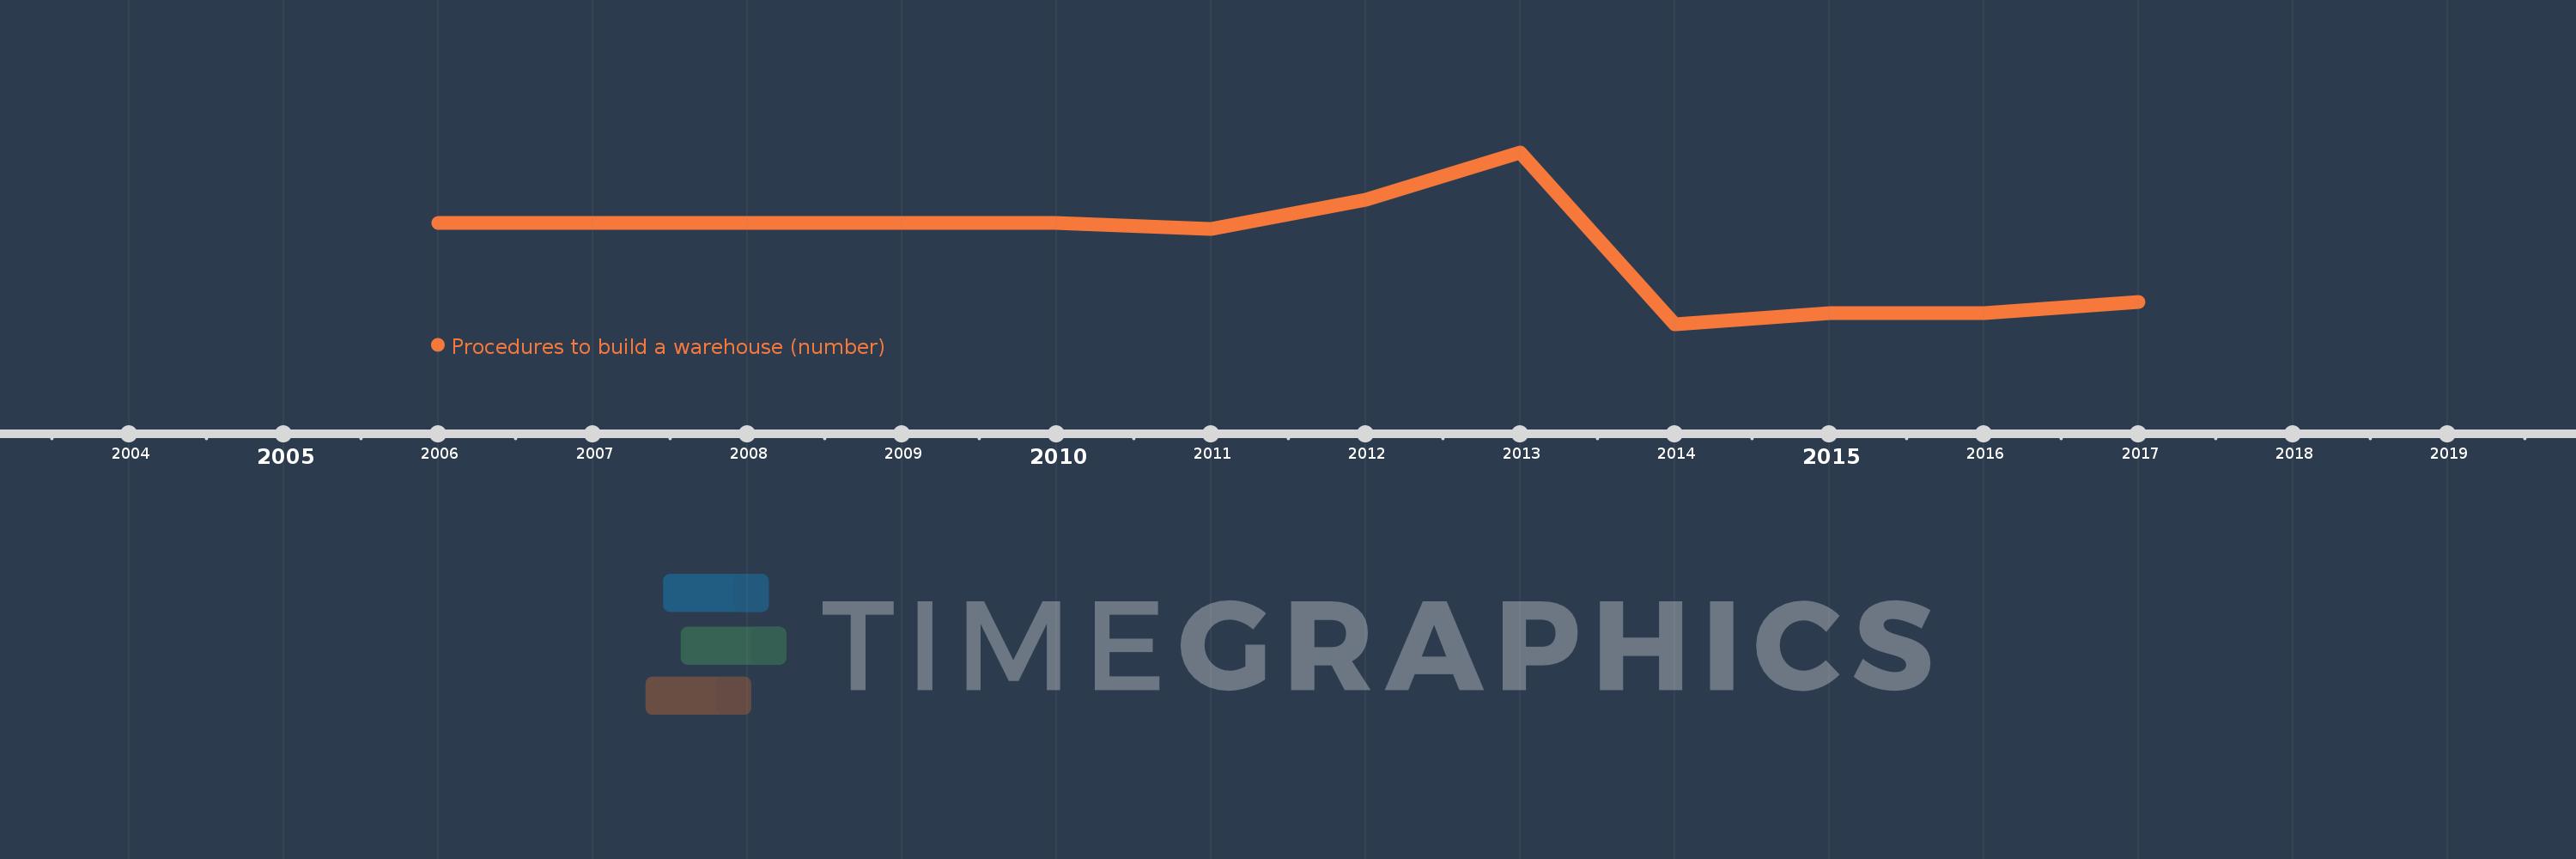
This timeline shows a graph from 2006 to 2017 of East Asia & Pacific (IDA & IBRD countries). No data until 2005. Number of actual observations by date: 12.
Source name:
World Development Indicators
Source organization:
World Bank, Doing Business project (http://www.doingbusiness.org/).
Categories, topics:
Private Sector
Last updated:
apr 23, 2017
Indicators value changes by year
Meaning:
16.055
Minimum:
15.381
jan 1, 2014
Maximum:
16.857
jan 1, 2013
At the date of observation
Value
Absolute change
Change from the previous value
jan 1, 2006
16.25
+16.25
0.0%
jan 1, 2007
16.25
0.0
0.0%
jan 1, 2008
16.25
0.0
0.0%
jan 1, 2009
16.25
0.0
0.0%
jan 1, 2010
16.25
0.0
0.0%
jan 1, 2011
16.2
-0.05
-0.31%
jan 1, 2012
16.45
+0.25
1.54%
jan 1, 2013
16.857
+0.407
2.48%
jan 1, 2014
15.381
-1.476
-8.76%
jan 1, 2015
15.476
+0.095
0.62%
jan 1, 2016
15.476
0.0
0.0%
jan 1, 2017
15.571
+0.095
0.62%
Ranking of countries by current statistics by years