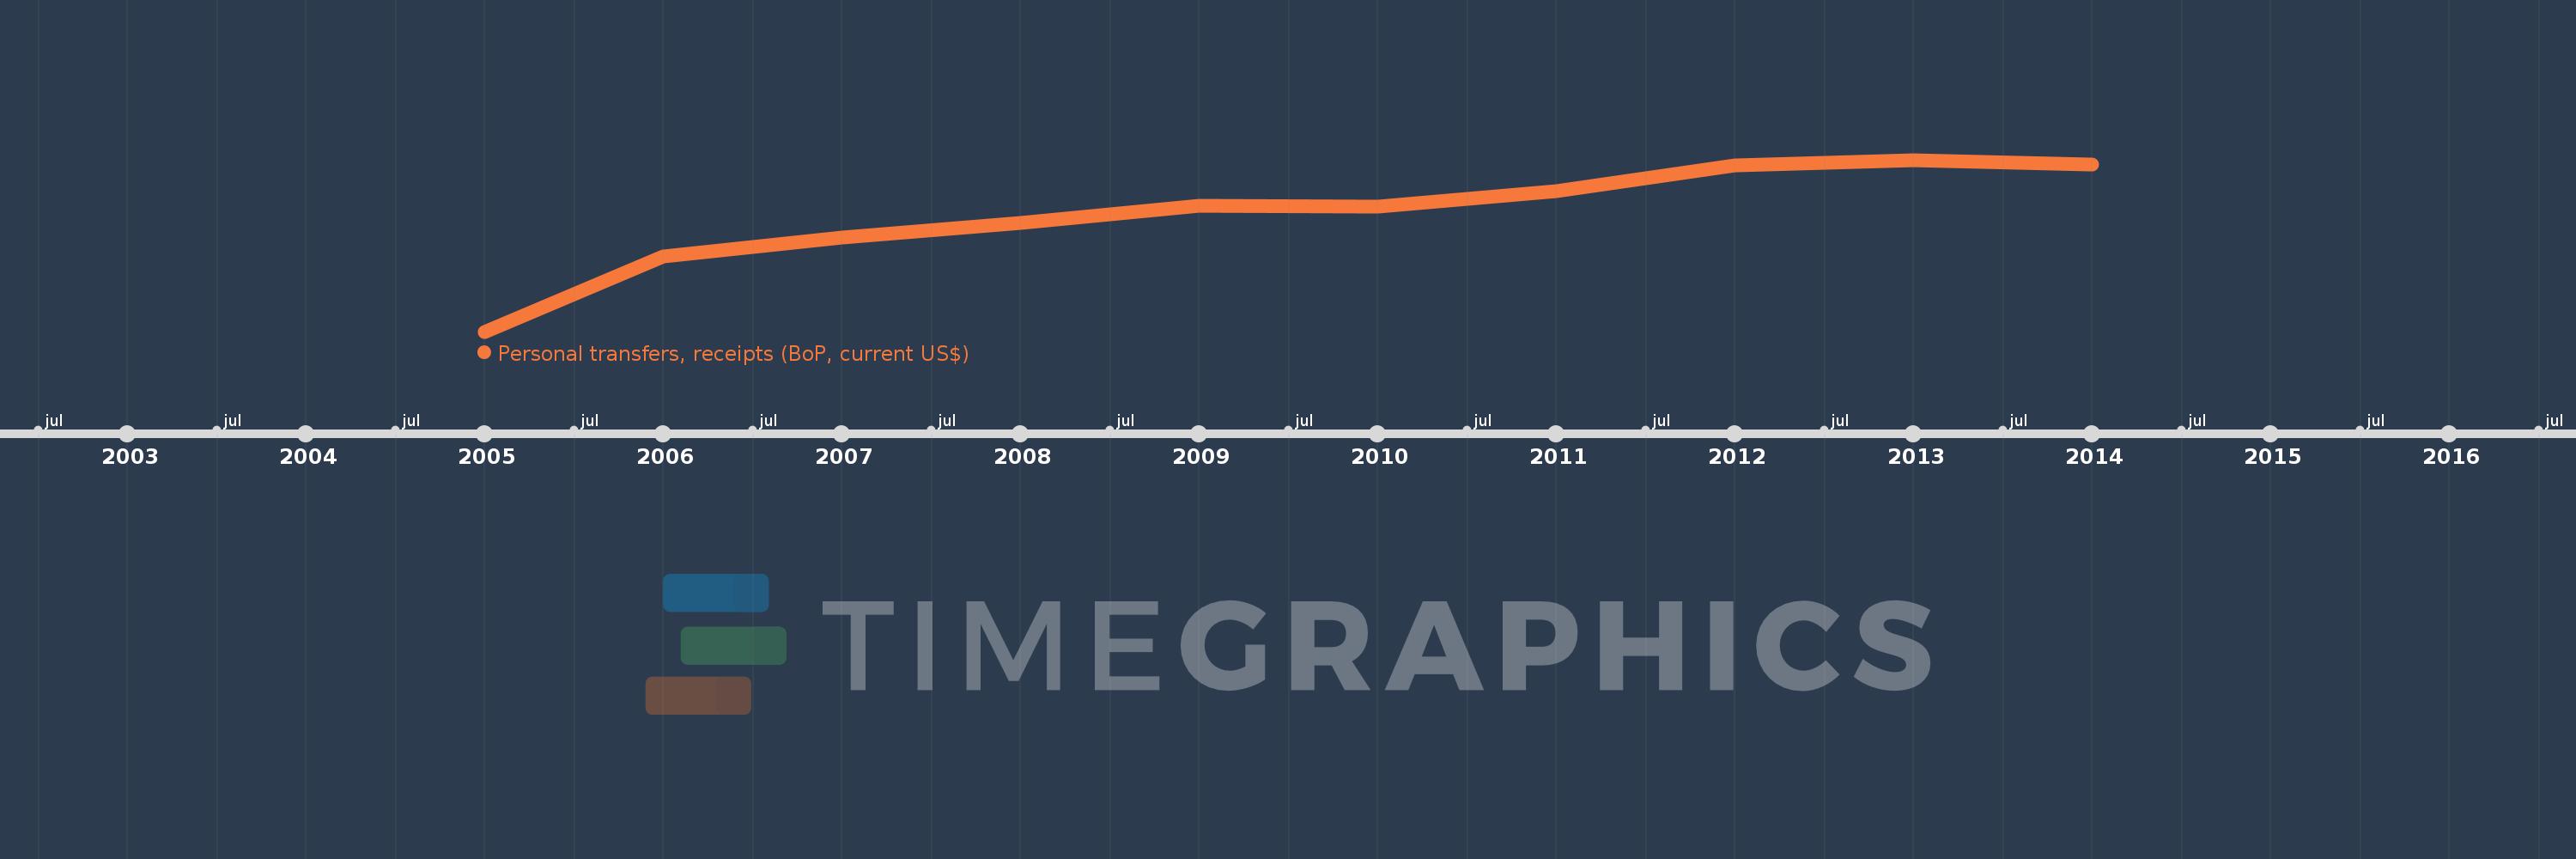
This timeline shows a graph from 2005 to 2014 of Sub-Saharan Africa (IDA & IBRD countries). No data until 2004. Number of actual observations by date: 10.
Source name:
World Development Indicators
Source organization:
International Monetary Fund, Balance of Payments Statistics Yearbook and data files.
Categories, topics:
Economy & Growth, Financial Sector
Last updated:
apr 23, 2017
Indicators value changes by year
Meaning:
24.946 bln
Minimum:
6.16 bln
jan 1, 2005
Maximum:
33.617 bln
jan 1, 2013
At the date of observation
Value
Absolute change
Change from the previous value
jan 1, 2005
6.16 bln
+6.16 bln
0.0%
jan 1, 2006
18.196 bln
+12.037 bln
195.4%
jan 1, 2007
21.24 bln
+3.044 bln
16.73%
jan 1, 2008
23.566 bln
+2.326 bln
10.95%
jan 1, 2009
26.293 bln
+2.727 bln
11.57%
jan 1, 2010
26.137 bln
-155.757 mln
-0.59%
jan 1, 2011
28.565 bln
+2.428 bln
9.29%
jan 1, 2012
32.766 bln
+4.201 bln
14.71%
jan 1, 2013
33.617 bln
+850.734 mln
2.6%
jan 1, 2014
32.919 bln
-697.58 mln
-2.08%
Ranking of countries by current statistics by years