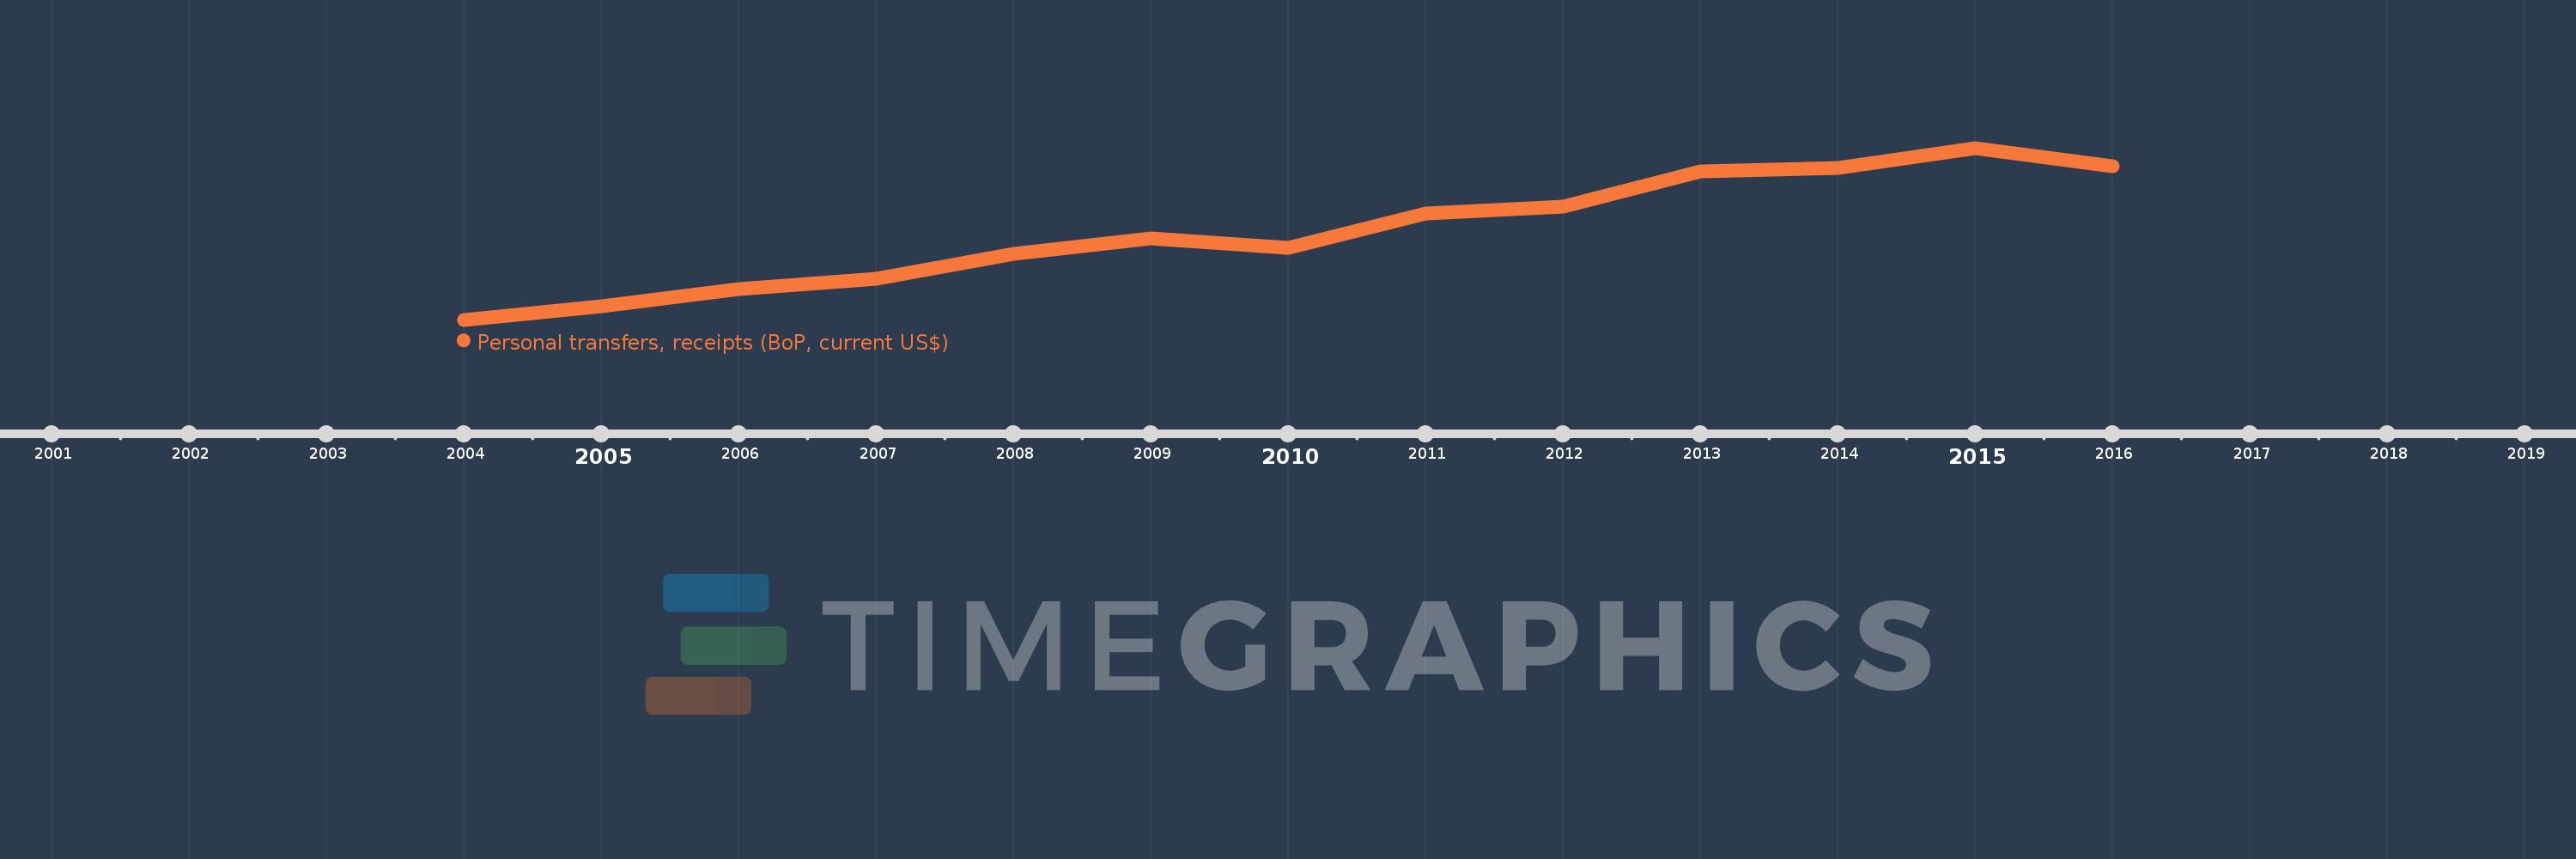
This timeline shows a graph from 2004 to 2016 of Middle East & North Africa (IDA & IBRD countries). No data until 2003. Number of actual observations by date: 13.
Source name:
World Development Indicators
Source organization:
International Monetary Fund, Balance of Payments Statistics Yearbook and data files.
Categories, topics:
Economy & Growth, Financial Sector
Last updated:
apr 23, 2017
Indicators value changes by year
Meaning:
30.222 bln
Minimum:
14.376 bln
jan 1, 2004
Maximum:
45.215 bln
jan 1, 2015
At the date of observation
Value
Absolute change
Change from the previous value
jan 1, 2004
14.376 bln
+14.376 bln
0.0%
jan 1, 2005
16.769 bln
+2.393 bln
16.65%
jan 1, 2006
19.916 bln
+3.147 bln
18.77%
jan 1, 2007
21.734 bln
+1.818 bln
9.13%
jan 1, 2008
26.214 bln
+4.48 bln
20.61%
jan 1, 2009
29.021 bln
+2.807 bln
10.71%
jan 1, 2010
27.224 bln
-1.796 bln
-6.19%
jan 1, 2011
33.421 bln
+6.197 bln
22.76%
jan 1, 2012
34.607 bln
+1.185 bln
3.55%
jan 1, 2013
40.93 bln
+6.323 bln
18.27%
jan 1, 2014
41.586 bln
+655.828 mln
1.6%
jan 1, 2015
45.215 bln
+3.629 bln
8.73%
jan 1, 2016
41.876 bln
-3.34 bln
-7.39%
Ranking of countries by current statistics by years