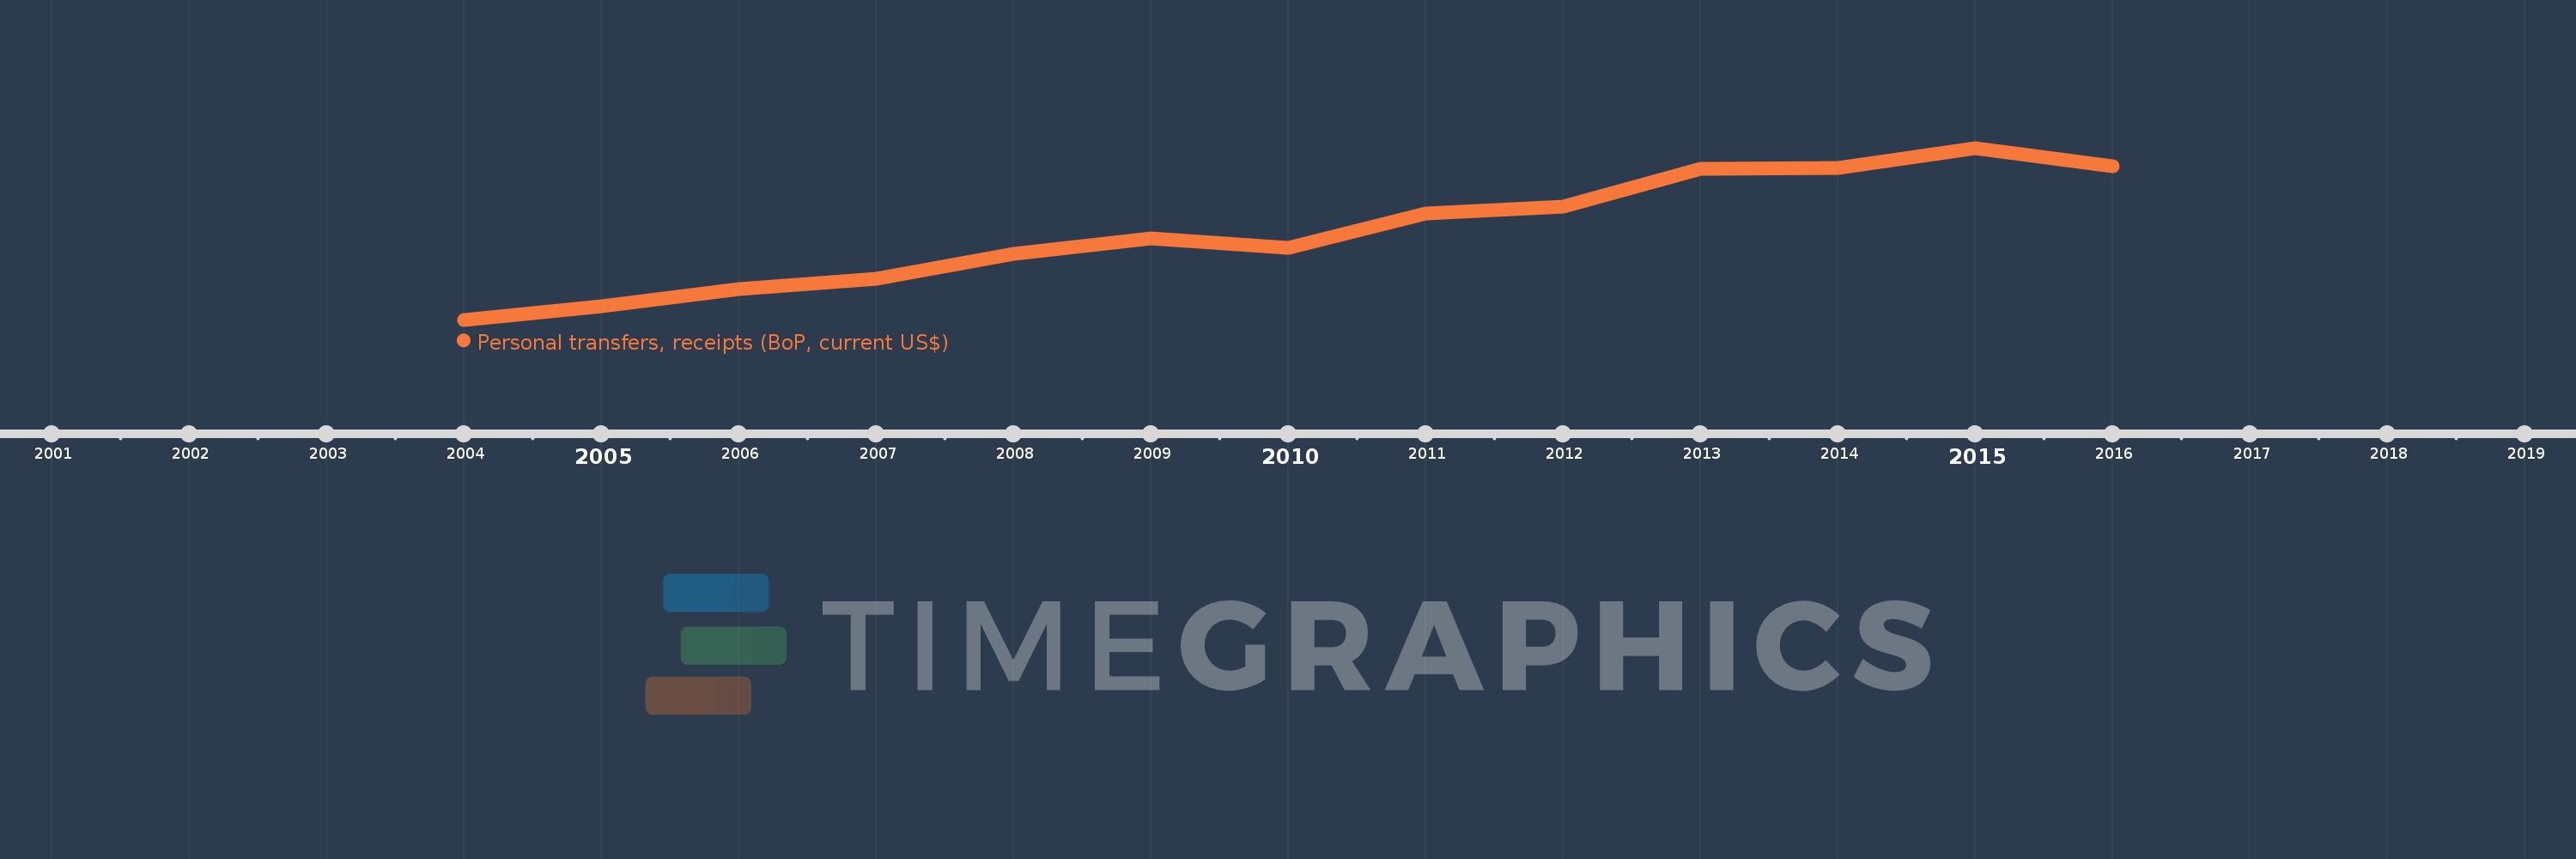
This timeline shows a graph from 2004 to 2016 of Middle East & North Africa (excluding high income). No data until 2003. Number of actual observations by date: 13.
Source name:
World Development Indicators
Source organization:
International Monetary Fund, Balance of Payments Statistics Yearbook and data files.
Categories, topics:
Economy & Growth, Financial Sector
Last updated:
apr 23, 2017
Indicators value changes by year
Meaning:
30.534 bln
Minimum:
14.49 bln
jan 1, 2004
Maximum:
45.57 bln
jan 1, 2015
At the date of observation
Value
Absolute change
Change from the previous value
jan 1, 2004
14.49 bln
+14.49 bln
0.0%
jan 1, 2005
16.965 bln
+2.475 bln
17.08%
jan 1, 2006
20.033 bln
+3.068 bln
18.09%
jan 1, 2007
21.889 bln
+1.856 bln
9.26%
jan 1, 2008
26.427 bln
+4.539 bln
20.73%
jan 1, 2009
29.263 bln
+2.836 bln
10.73%
jan 1, 2010
27.493 bln
-1.77 bln
-6.05%
jan 1, 2011
33.77 bln
+6.278 bln
22.83%
jan 1, 2012
35.012 bln
+1.242 bln
3.68%
jan 1, 2013
41.844 bln
+6.832 bln
19.51%
jan 1, 2014
41.944 bln
+100.116 mln
0.24%
jan 1, 2015
45.57 bln
+3.626 bln
8.64%
jan 1, 2016
42.246 bln
-3.324 bln
-7.29%
Ranking of countries by current statistics by years