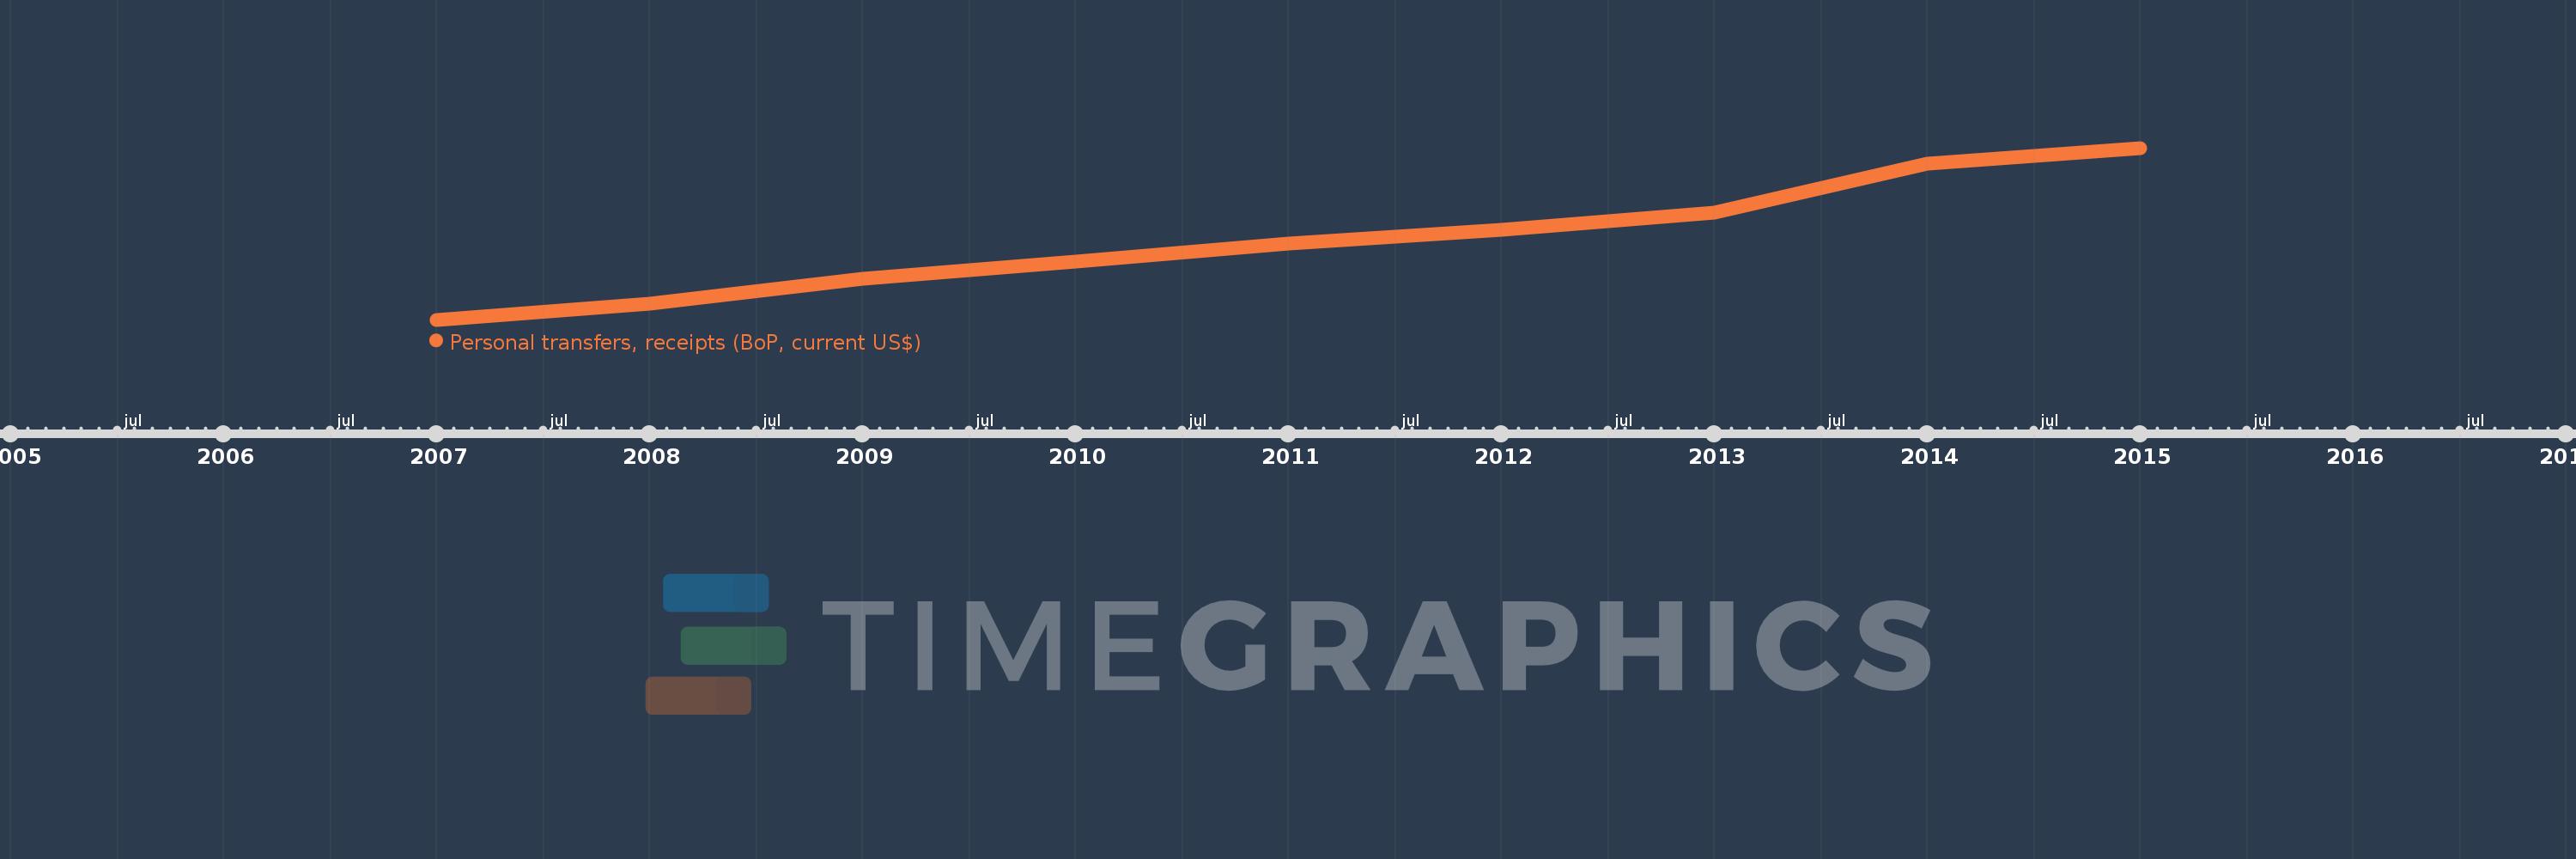
This timeline shows a graph from 2007 to 2015 of East Asia & Pacific (excluding high income). No data until 2006. Number of actual observations by date: 9.
Source name:
World Development Indicators
Source organization:
International Monetary Fund, Balance of Payments Statistics Yearbook and data files.
Categories, topics:
Economy & Growth, Financial Sector
Last updated:
apr 23, 2017
Indicators value changes by year
Meaning:
27.378 bln
Minimum:
20.363 bln
jan 1, 2007
Maximum:
35.487 bln
jan 1, 2015
At the date of observation
Value
Absolute change
Change from the previous value
jan 1, 2007
20.363 bln
+20.363 bln
0.0%
jan 1, 2008
21.754 bln
+1.391 bln
6.83%
jan 1, 2009
23.996 bln
+2.242 bln
10.3%
jan 1, 2010
25.459 bln
+1.463 bln
6.1%
jan 1, 2011
27.082 bln
+1.623 bln
6.37%
jan 1, 2012
28.307 bln
+1.225 bln
4.53%
jan 1, 2013
29.823 bln
+1.515 bln
5.35%
jan 1, 2014
34.134 bln
+4.312 bln
14.46%
jan 1, 2015
35.487 bln
+1.353 bln
3.96%
Ranking of countries by current statistics by years