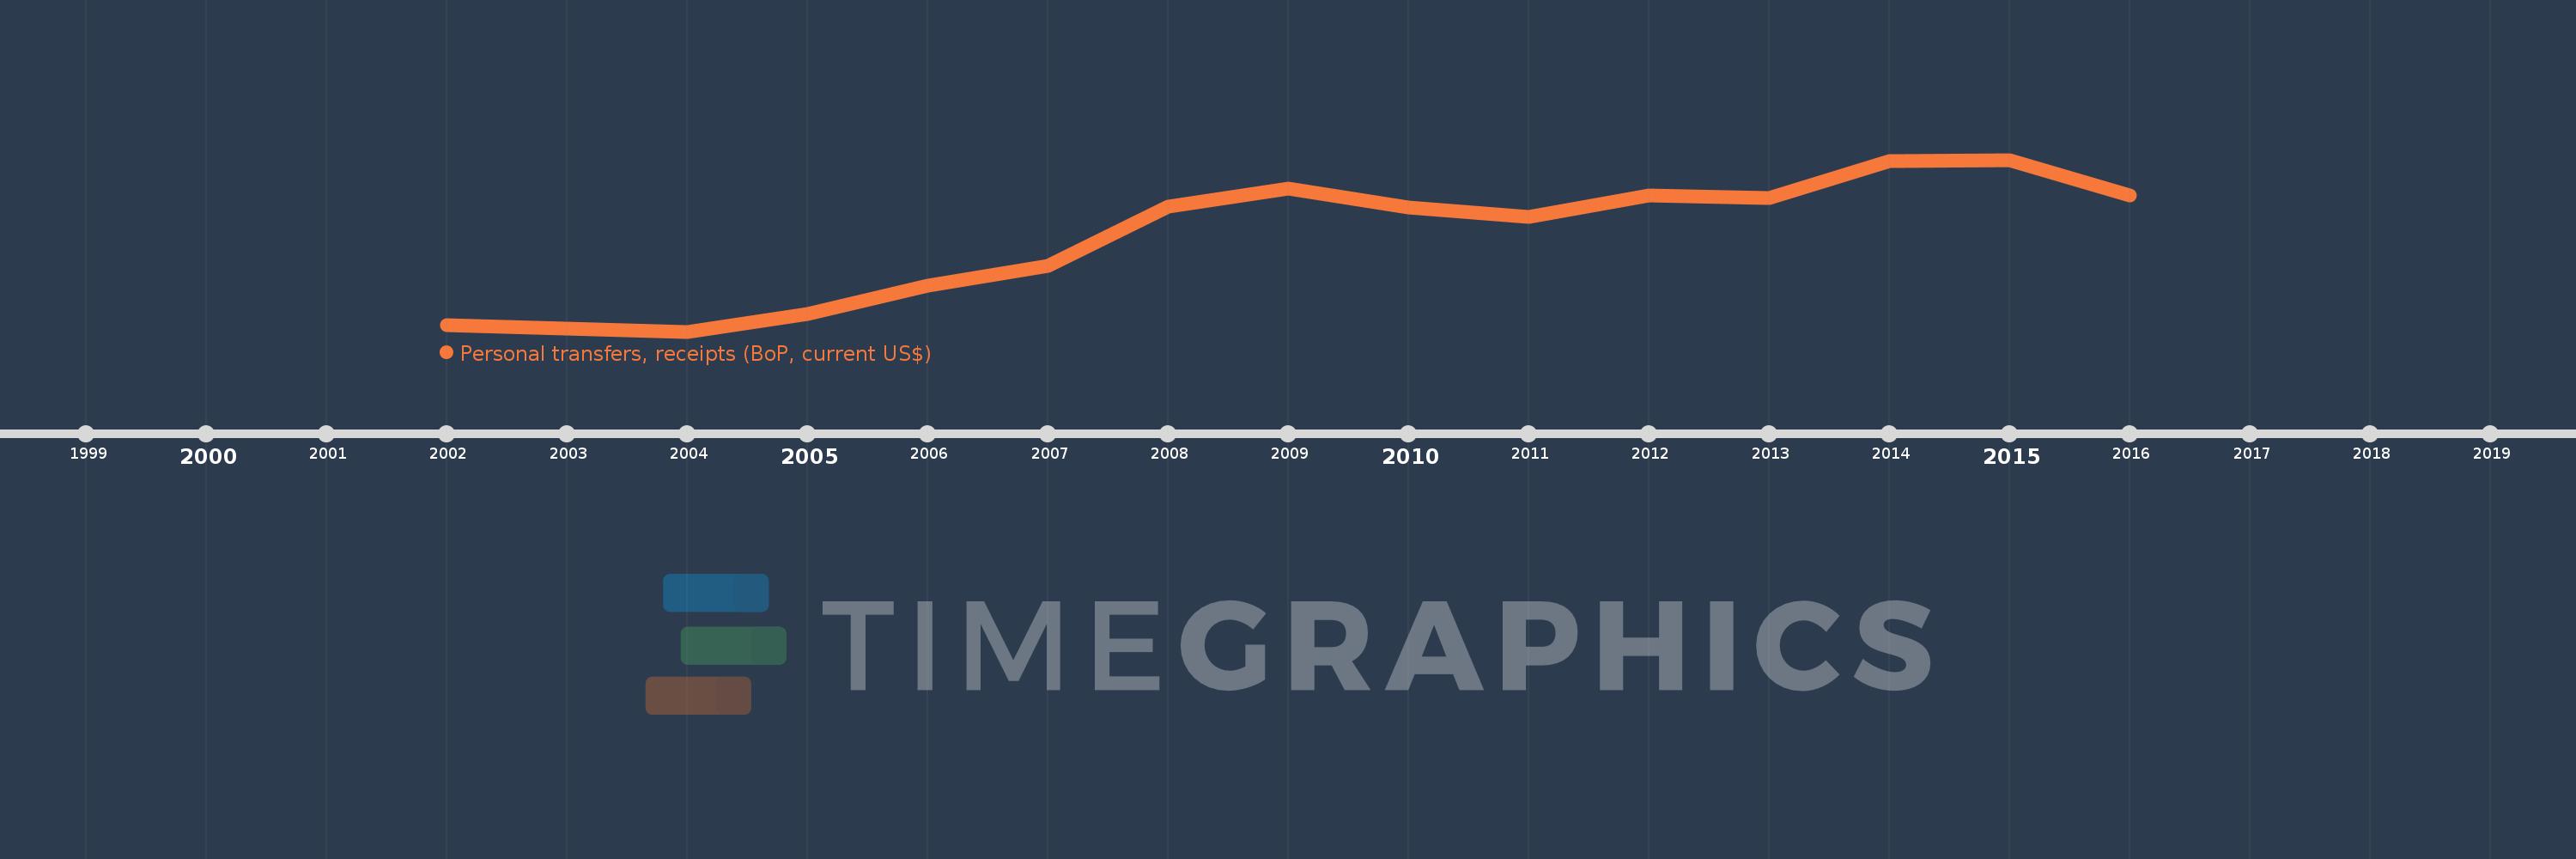
This timeline shows a graph from 2002 to 2016 of Europe & Central Asia (excluding high income). No data until 2001. Number of actual observations by date: 15.
Source name:
World Development Indicators
Source organization:
International Monetary Fund, Balance of Payments Statistics Yearbook and data files.
Categories, topics:
Economy & Growth, Financial Sector
Last updated:
apr 23, 2017
Indicators value changes by year
Meaning:
16.871 bln
Minimum:
4.876 bln
jan 1, 2004
Maximum:
27.063 bln
jan 1, 2015
At the date of observation
Value
Absolute change
Change from the previous value
jan 1, 2002
5.762 bln
+5.762 bln
0.0%
jan 1, 2003
5.258 bln
-503.994 mln
-8.75%
jan 1, 2004
4.876 bln
-381.955 mln
-7.26%
jan 1, 2005
7.1 bln
+2.224 bln
45.62%
jan 1, 2006
10.766 bln
+3.665 bln
51.62%
jan 1, 2007
13.355 bln
+2.589 bln
24.05%
jan 1, 2008
21.072 bln
+7.717 bln
57.79%
jan 1, 2009
23.351 bln
+2.279 bln
10.81%
jan 1, 2010
20.954 bln
-2.397 bln
-10.26%
jan 1, 2011
19.655 bln
-1.299 bln
-6.2%
jan 1, 2012
22.441 bln
+2.786 bln
14.17%
jan 1, 2013
22.153 bln
-287.952 mln
-1.28%
jan 1, 2014
26.841 bln
+4.689 bln
21.17%
jan 1, 2015
27.063 bln
+221.351 mln
0.82%
jan 1, 2016
22.421 bln
-4.642 bln
-17.15%
Ranking of countries by current statistics by years