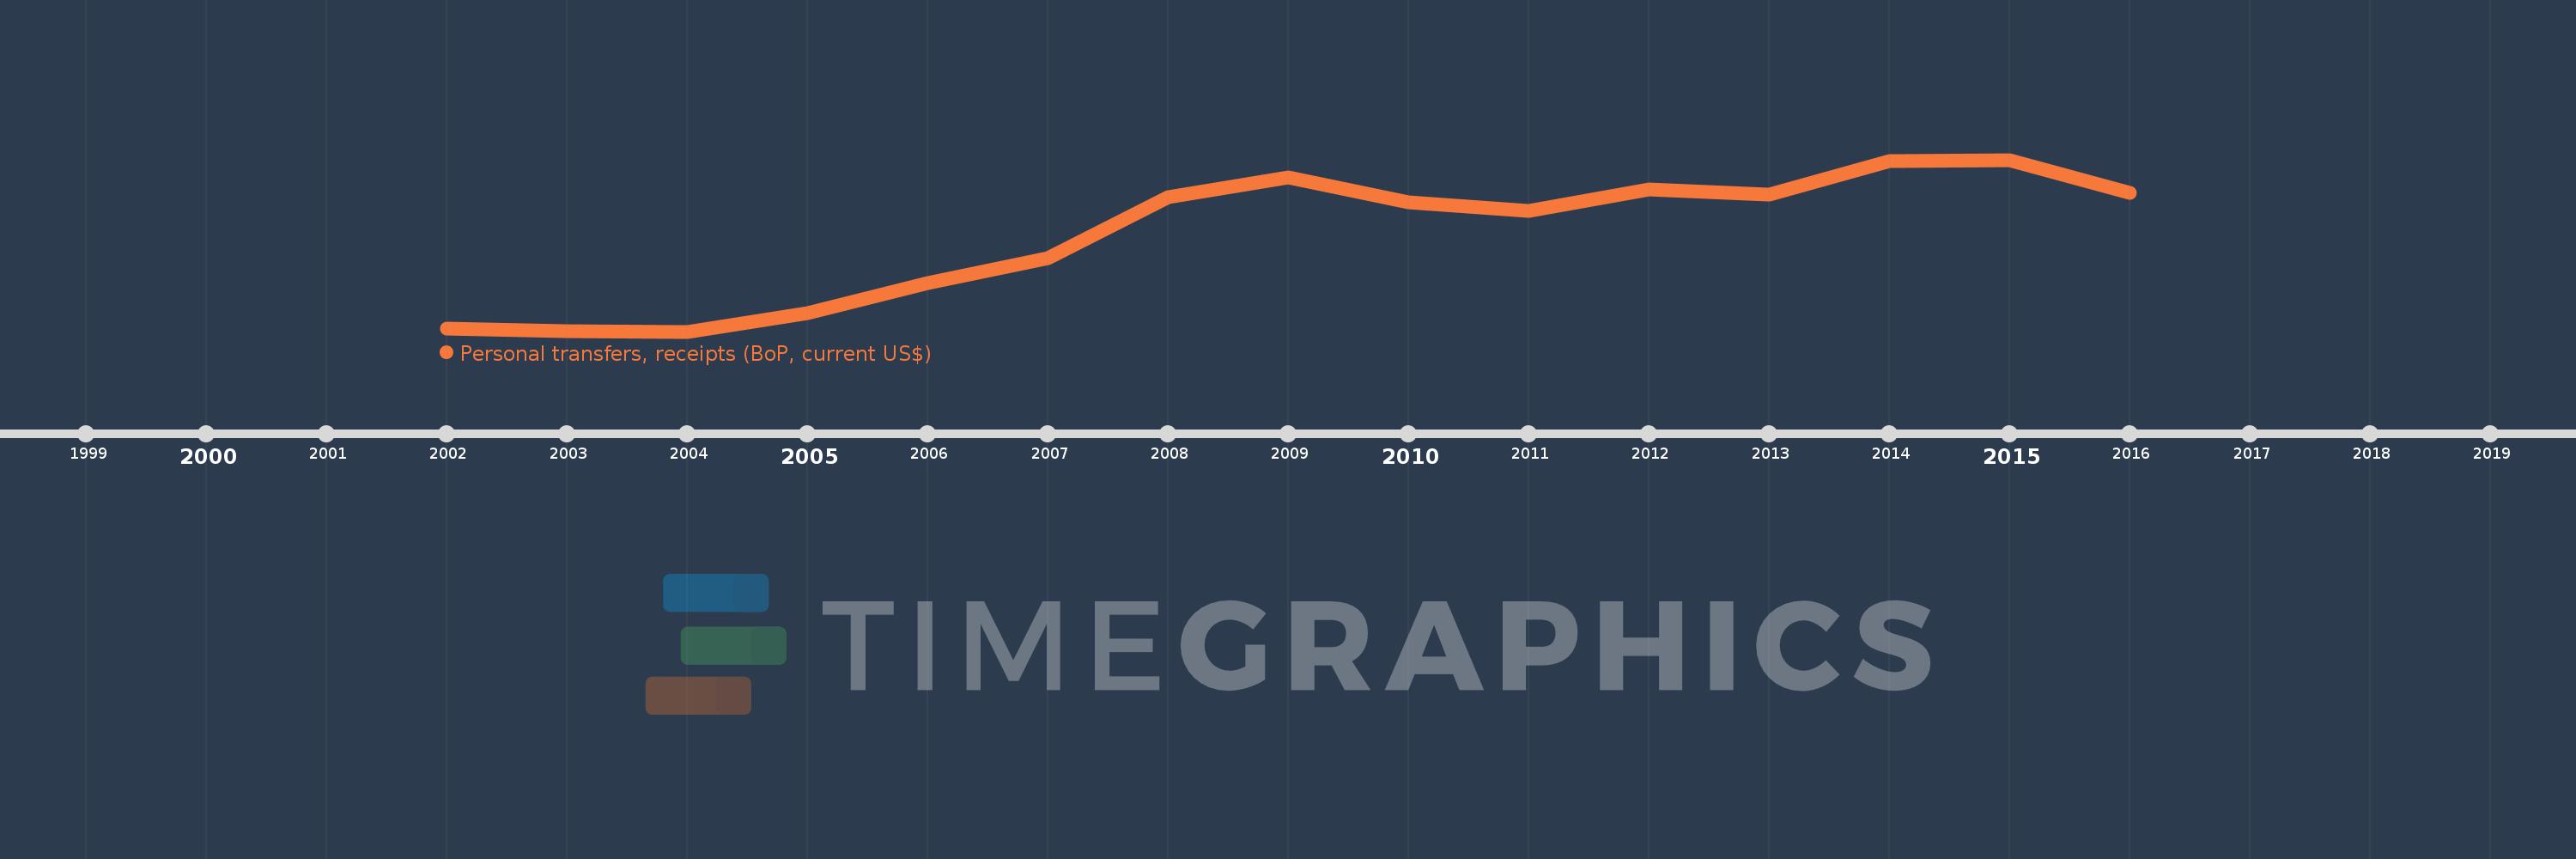
This timeline shows a graph from 2002 to 2016 of Europe & Central Asia (IDA & IBRD countries). No data until 2001. Number of actual observations by date: 15.
Source name:
World Development Indicators
Source organization:
International Monetary Fund, Balance of Payments Statistics Yearbook and data files.
Categories, topics:
Economy & Growth, Financial Sector
Last updated:
apr 23, 2017
Indicators value changes by year
Meaning:
20.796 bln
Minimum:
6.692 bln
jan 1, 2004
Maximum:
31.887 bln
jan 1, 2015
At the date of observation
Value
Absolute change
Change from the previous value
jan 1, 2002
7.143 bln
+7.143 bln
0.0%
jan 1, 2003
6.767 bln
-376.024 mln
-5.26%
jan 1, 2004
6.692 bln
-74.771 mln
-1.1%
jan 1, 2005
9.446 bln
+2.754 bln
41.16%
jan 1, 2006
13.79 bln
+4.343 bln
45.98%
jan 1, 2007
17.411 bln
+3.621 bln
26.26%
jan 1, 2008
26.444 bln
+9.033 bln
51.88%
jan 1, 2009
29.306 bln
+2.862 bln
10.82%
jan 1, 2010
25.707 bln
-3.599 bln
-12.28%
jan 1, 2011
24.381 bln
-1.326 bln
-5.16%
jan 1, 2012
27.482 bln
+3.101 bln
12.72%
jan 1, 2013
26.766 bln
-715.066 mln
-2.6%
jan 1, 2014
31.725 bln
+4.959 bln
18.53%
jan 1, 2015
31.887 bln
+161.753 mln
0.51%
jan 1, 2016
26.986 bln
-4.9 bln
-15.37%
Ranking of countries by current statistics by years