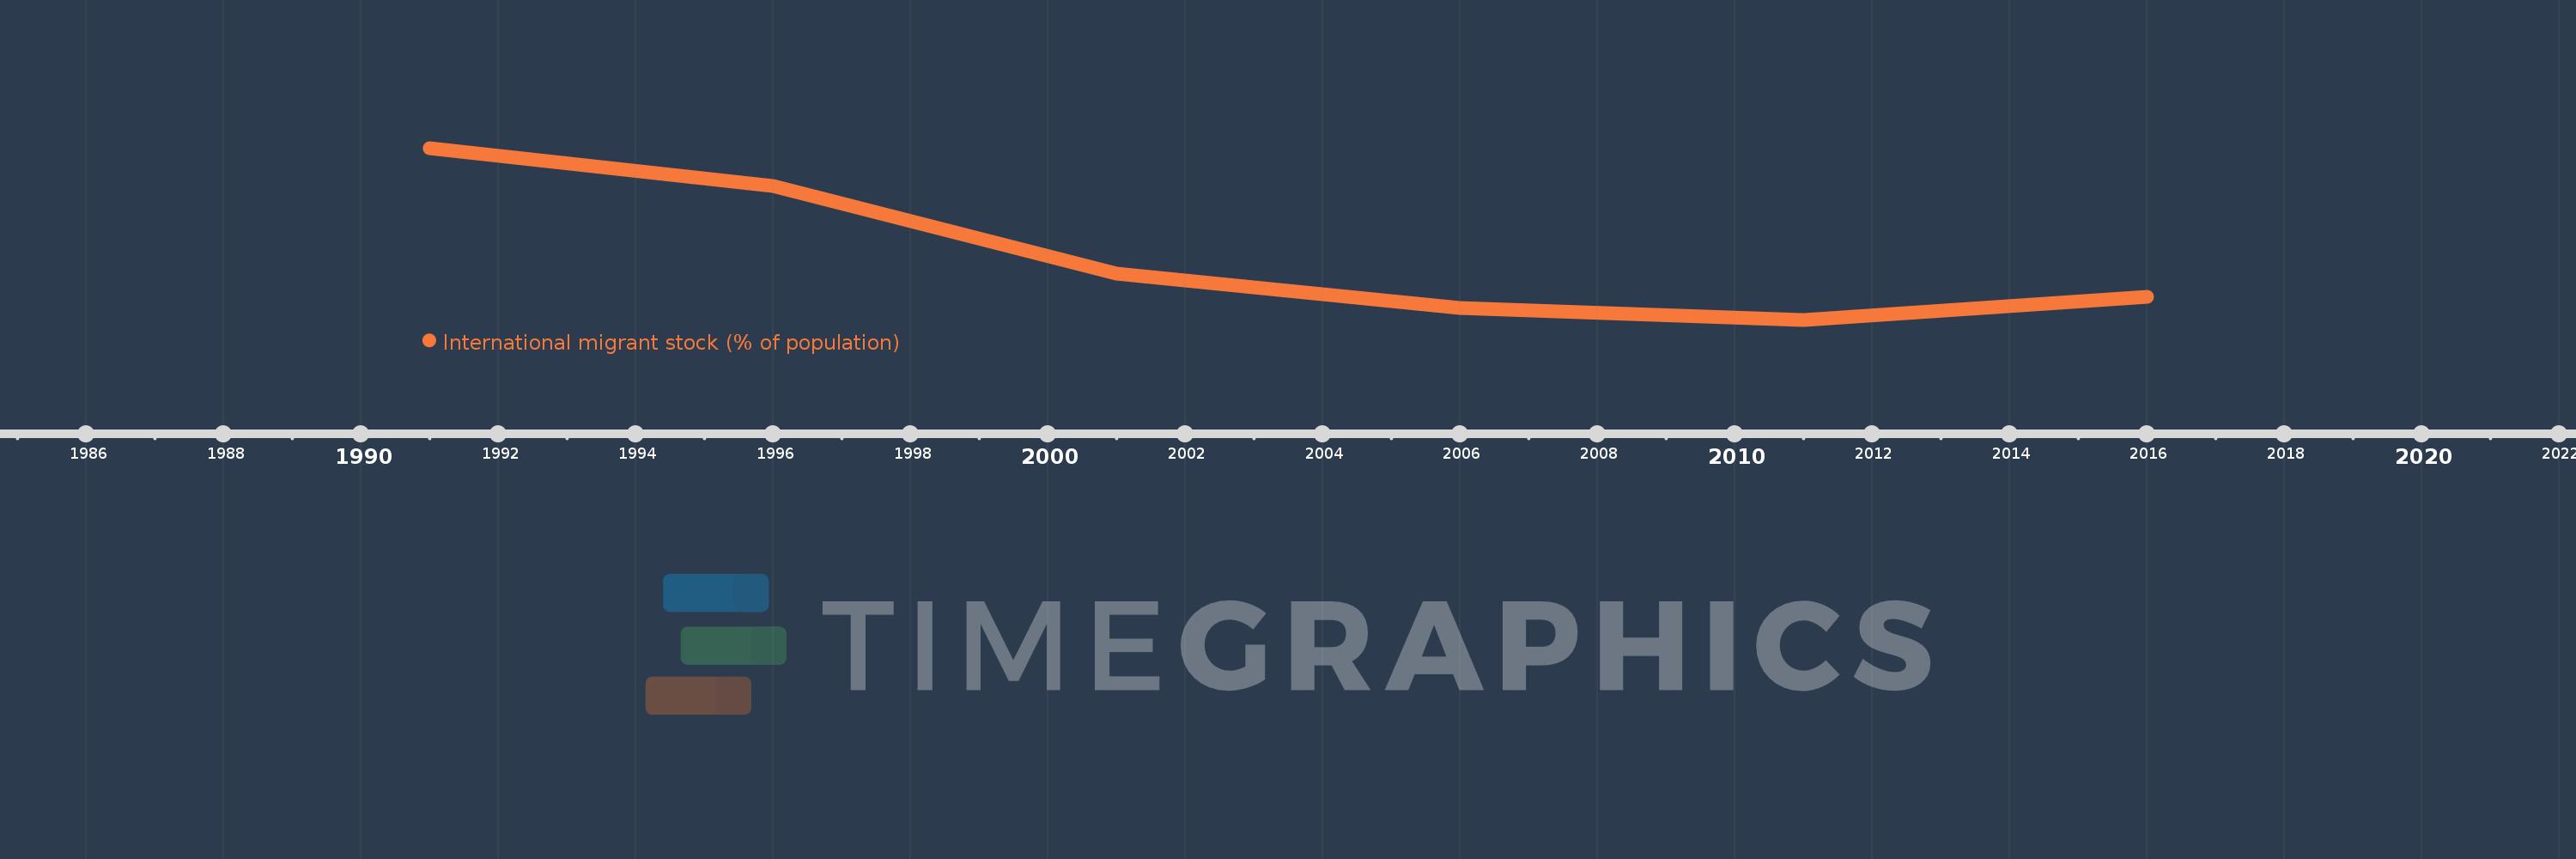
This timeline shows a graph from 1991 to 2016 of Sub-Saharan Africa (IDA & IBRD countries). No data until 1990. Number of actual observations by date: 6.
Source name:
World Development Indicators
Source organization:
United Nations Population Division, Trends in Total Migrant Stock: 2008 Revision.
Categories, topics:
Financial Sector, Health
Last updated:
apr 23, 2017
Indicators value changes by year
Meaning:
2.13
Minimum:
1.721
jan 1, 2011
Maximum:
2.81
jan 1, 1991
At the date of observation
Value
Absolute change
Change from the previous value
jan 1, 1991
2.81
+2.81
0.0%
jan 1, 1996
2.571
-0.239
-8.5%
jan 1, 2001
2.011
-0.56
-21.79%
jan 1, 2006
1.795
-0.216
-10.74%
jan 1, 2011
1.721
-0.074
-4.12%
jan 1, 2016
1.868
+0.147
8.55%
Ranking of countries by current statistics by years