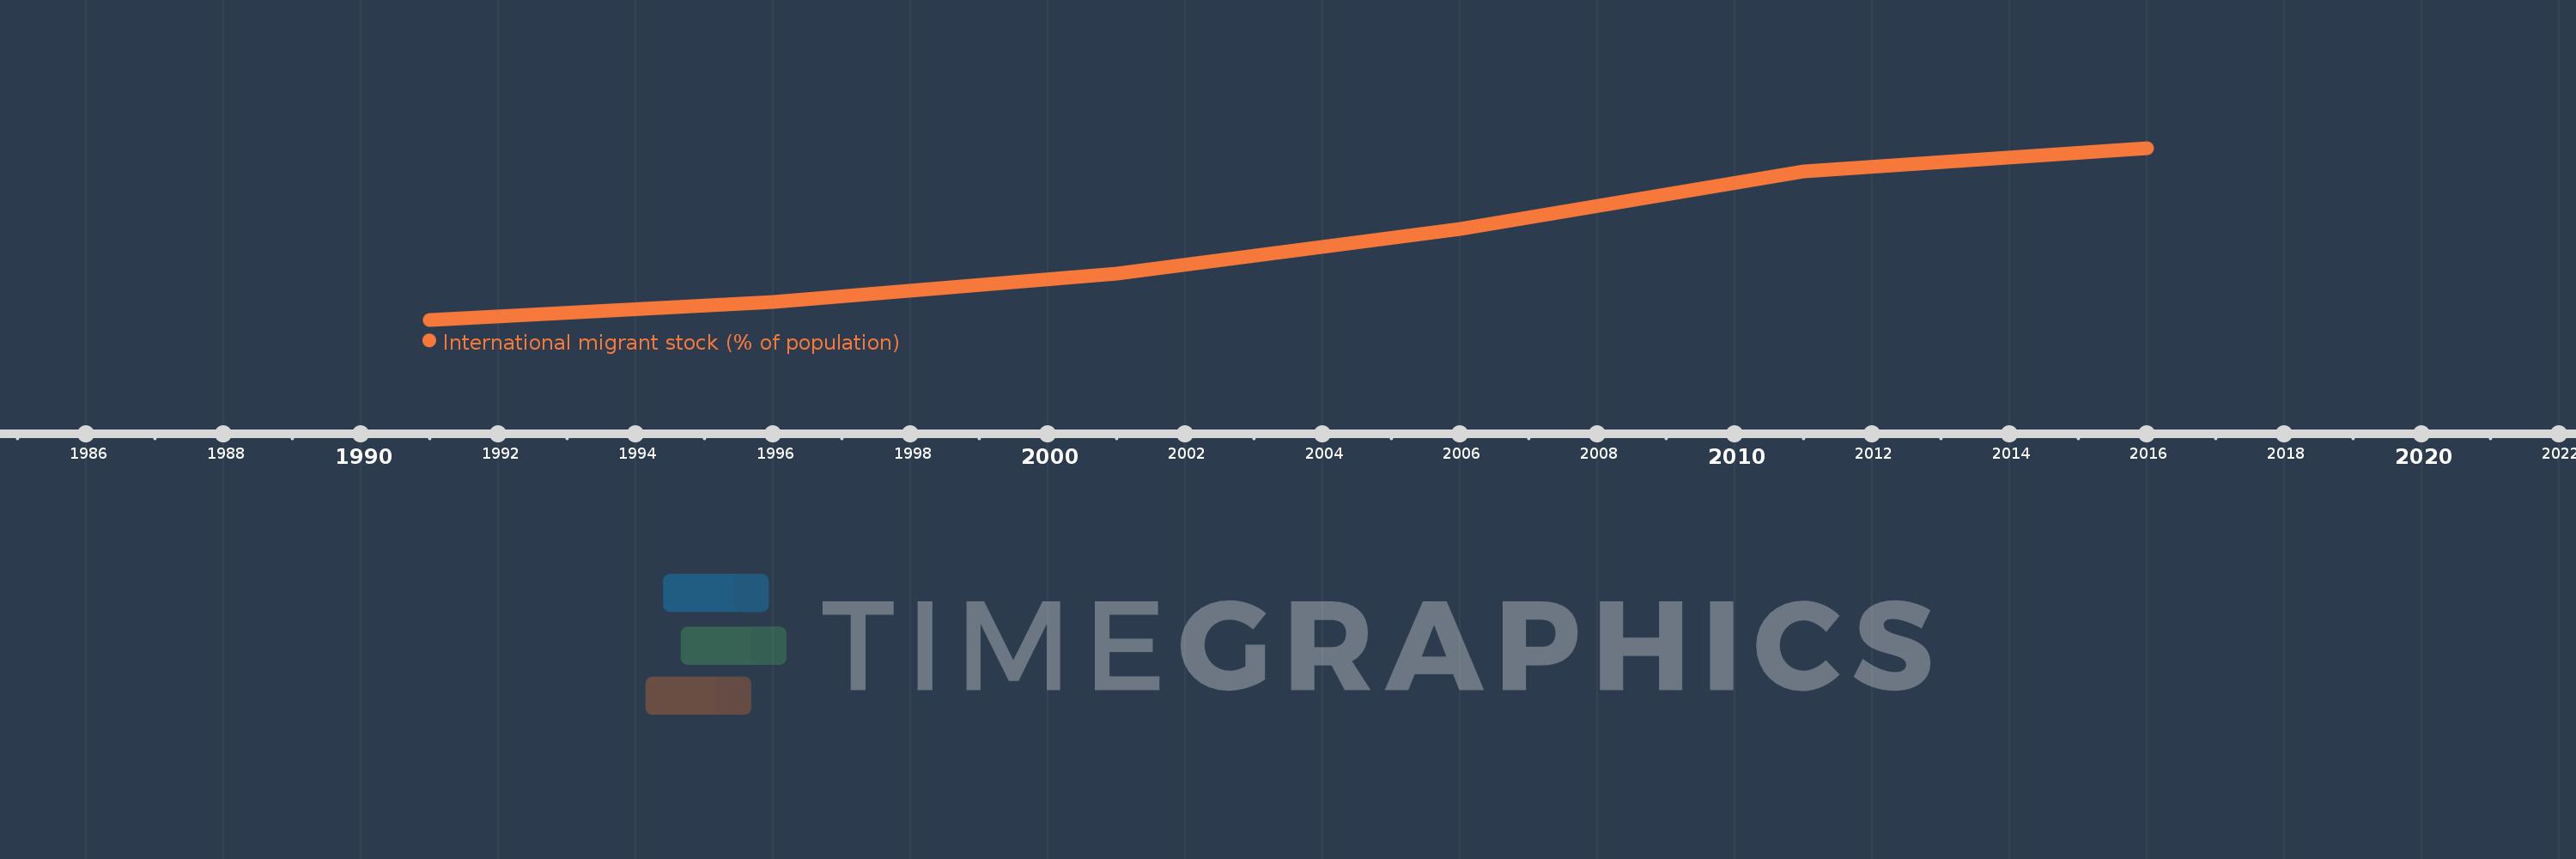
This timeline shows a graph from 1991 to 2016 of East Asia & Pacific (IDA & IBRD countries). No data until 1990. Number of actual observations by date: 6.
Source name:
World Development Indicators
Source organization:
United Nations Population Division, Trends in Total Migrant Stock: 2008 Revision.
Categories, topics:
Financial Sector, Health
Last updated:
apr 23, 2017
Indicators value changes by year
Meaning:
0.276
Minimum:
0.159
jan 1, 1991
Maximum:
0.412
jan 1, 2016
At the date of observation
Value
Absolute change
Change from the previous value
jan 1, 1991
0.159
+0.159
0.0%
jan 1, 1996
0.185
+0.026
16.28%
jan 1, 2001
0.227
+0.041
22.29%
jan 1, 2006
0.293
+0.066
29.15%
jan 1, 2011
0.378
+0.085
29.14%
jan 1, 2016
0.412
+0.034
9.07%
Ranking of countries by current statistics by years