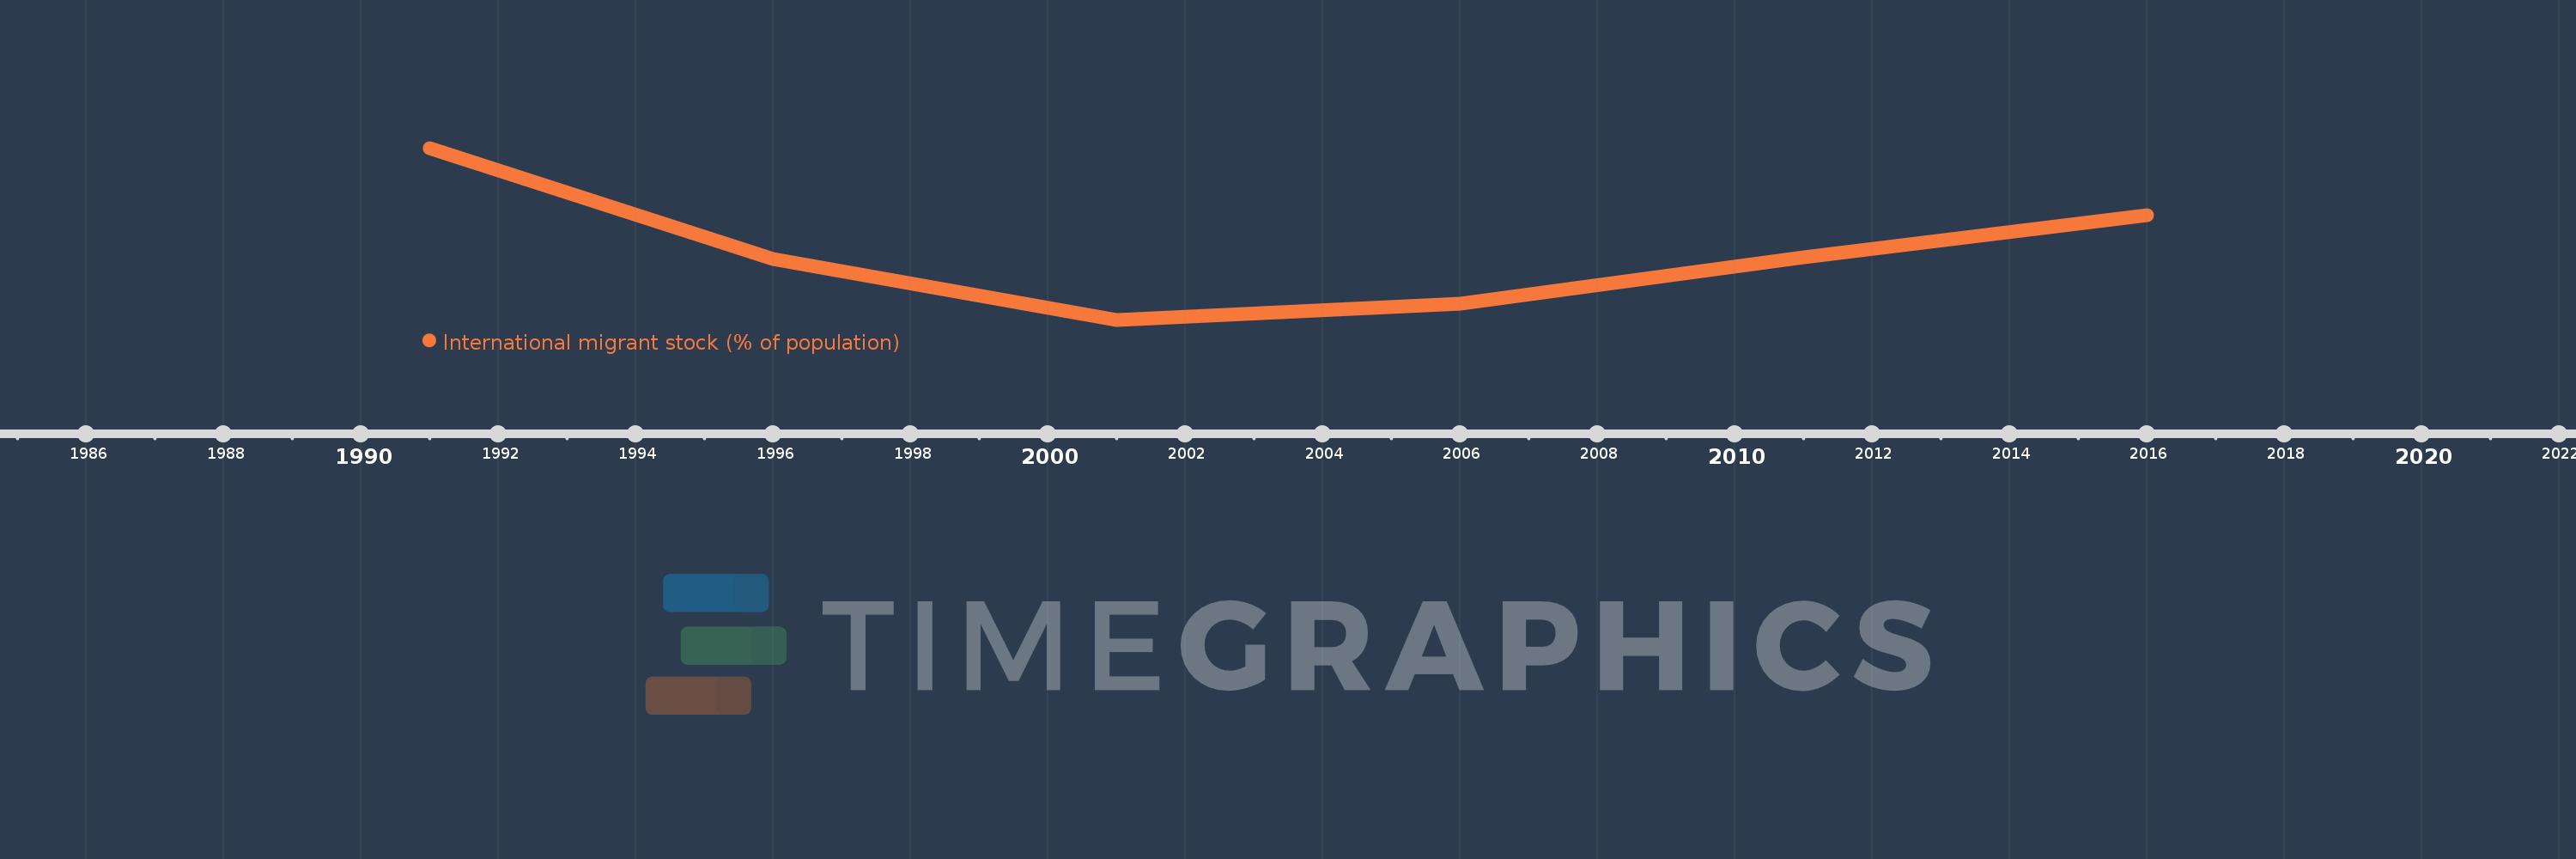
This timeline shows a graph from 1991 to 2016 of Latin America & the Caribbean (IDA & IBRD countries). No data until 1990. Number of actual observations by date: 6.
Source name:
World Development Indicators
Source organization:
United Nations Population Division, Trends in Total Migrant Stock: 2008 Revision.
Categories, topics:
Financial Sector, Health
Last updated:
apr 23, 2017
Indicators value changes by year
Meaning:
1.277
Minimum:
1.127
jan 1, 2001
Maximum:
1.499
jan 1, 1991
At the date of observation
Value
Absolute change
Change from the previous value
jan 1, 1991
1.499
+1.499
0.0%
jan 1, 1996
1.259
-0.241
-16.05%
jan 1, 2001
1.127
-0.132
-10.46%
jan 1, 2006
1.162
+0.035
3.1%
jan 1, 2011
1.263
+0.101
8.73%
jan 1, 2016
1.354
+0.091
7.19%
Ranking of countries by current statistics by years