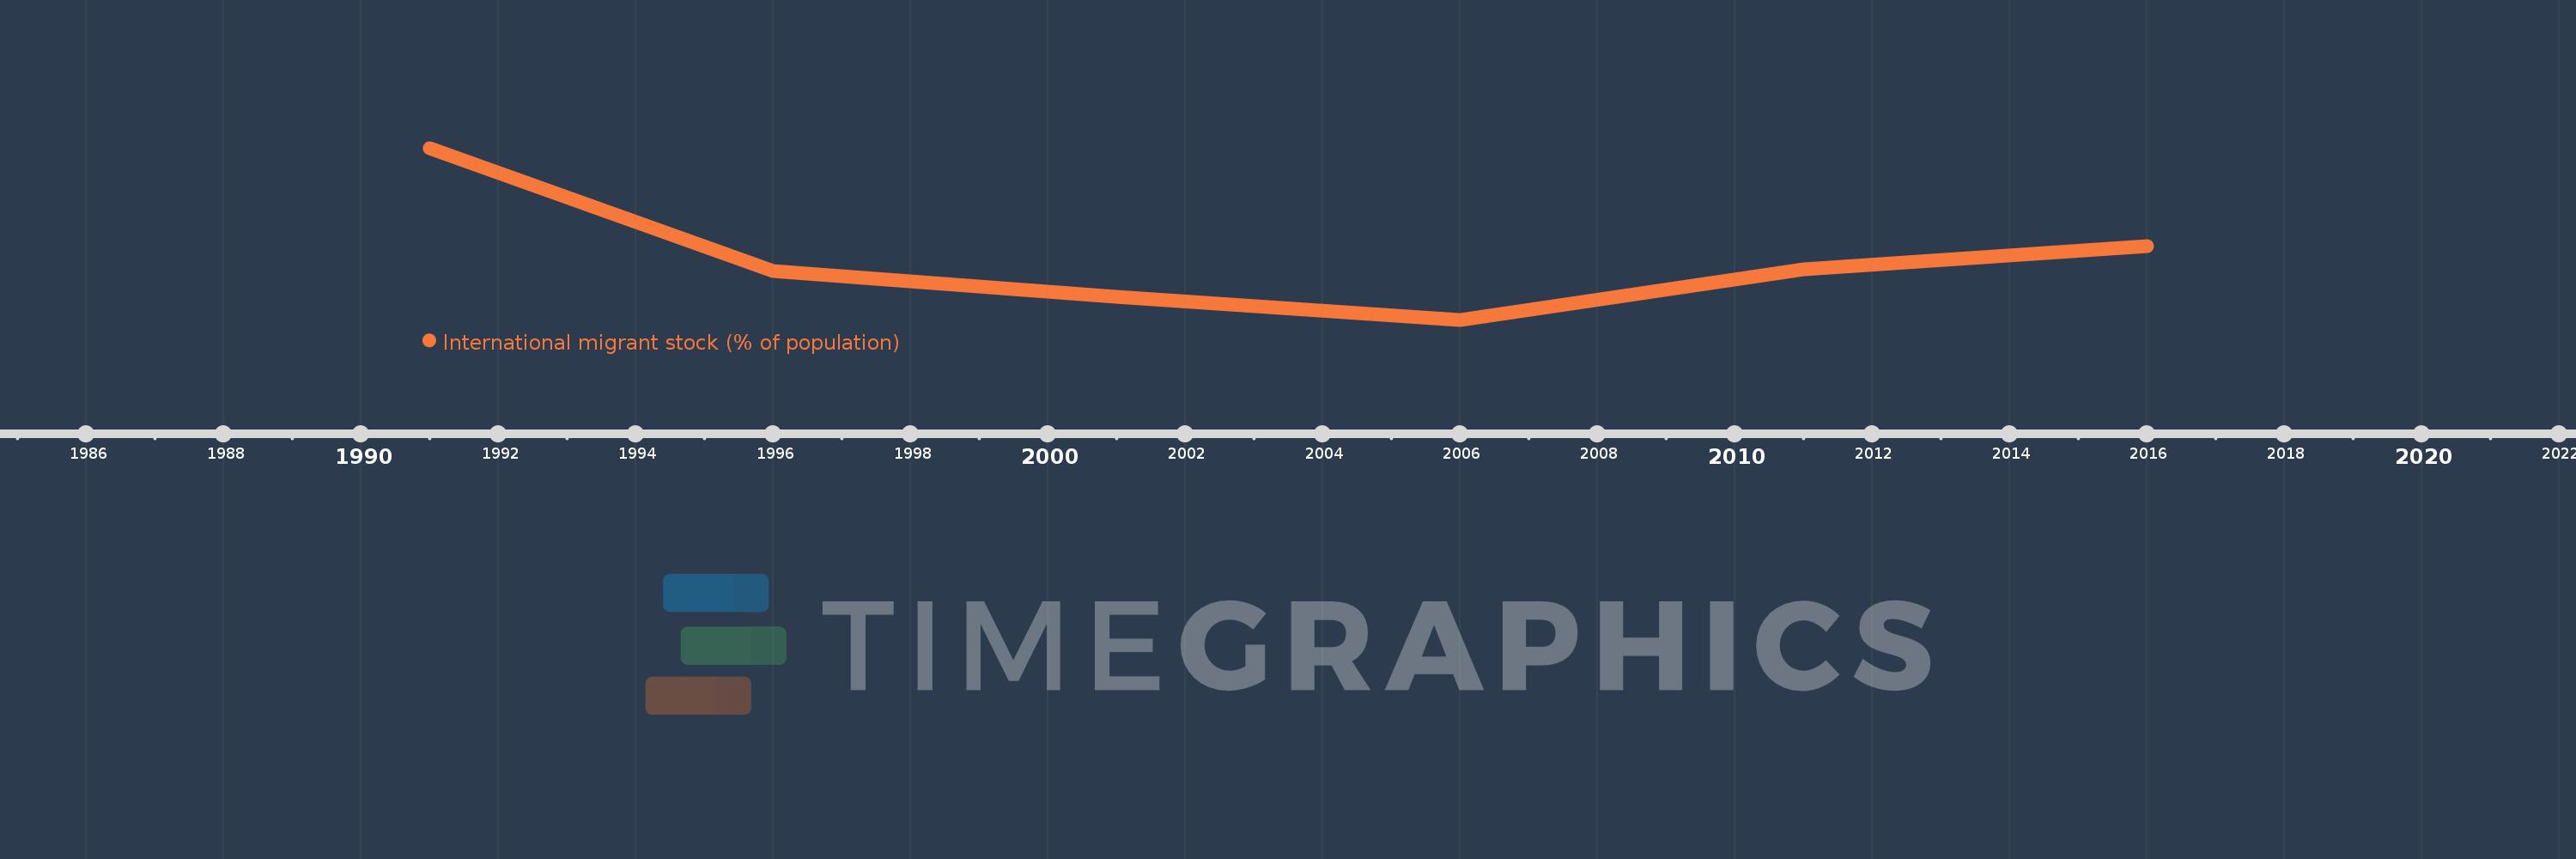
This timeline shows a graph from 1991 to 2016 of Middle East & North Africa (excluding high income). No data until 1990. Number of actual observations by date: 6.
Source name:
World Development Indicators
Source organization:
United Nations Population Division, Trends in Total Migrant Stock: 2008 Revision.
Categories, topics:
Financial Sector, Health
Last updated:
apr 23, 2017
Indicators value changes by year
Meaning:
3.084
Minimum:
2.769
jan 1, 2006
Maximum:
3.651
jan 1, 1991
At the date of observation
Value
Absolute change
Change from the previous value
jan 1, 1991
3.651
+3.651
0.0%
jan 1, 1996
3.02
-0.63
-17.27%
jan 1, 2001
2.886
-0.134
-4.44%
jan 1, 2006
2.769
-0.117
-4.07%
jan 1, 2011
3.028
+0.26
9.37%
jan 1, 2016
3.148
+0.12
3.95%
Ranking of countries by current statistics by years