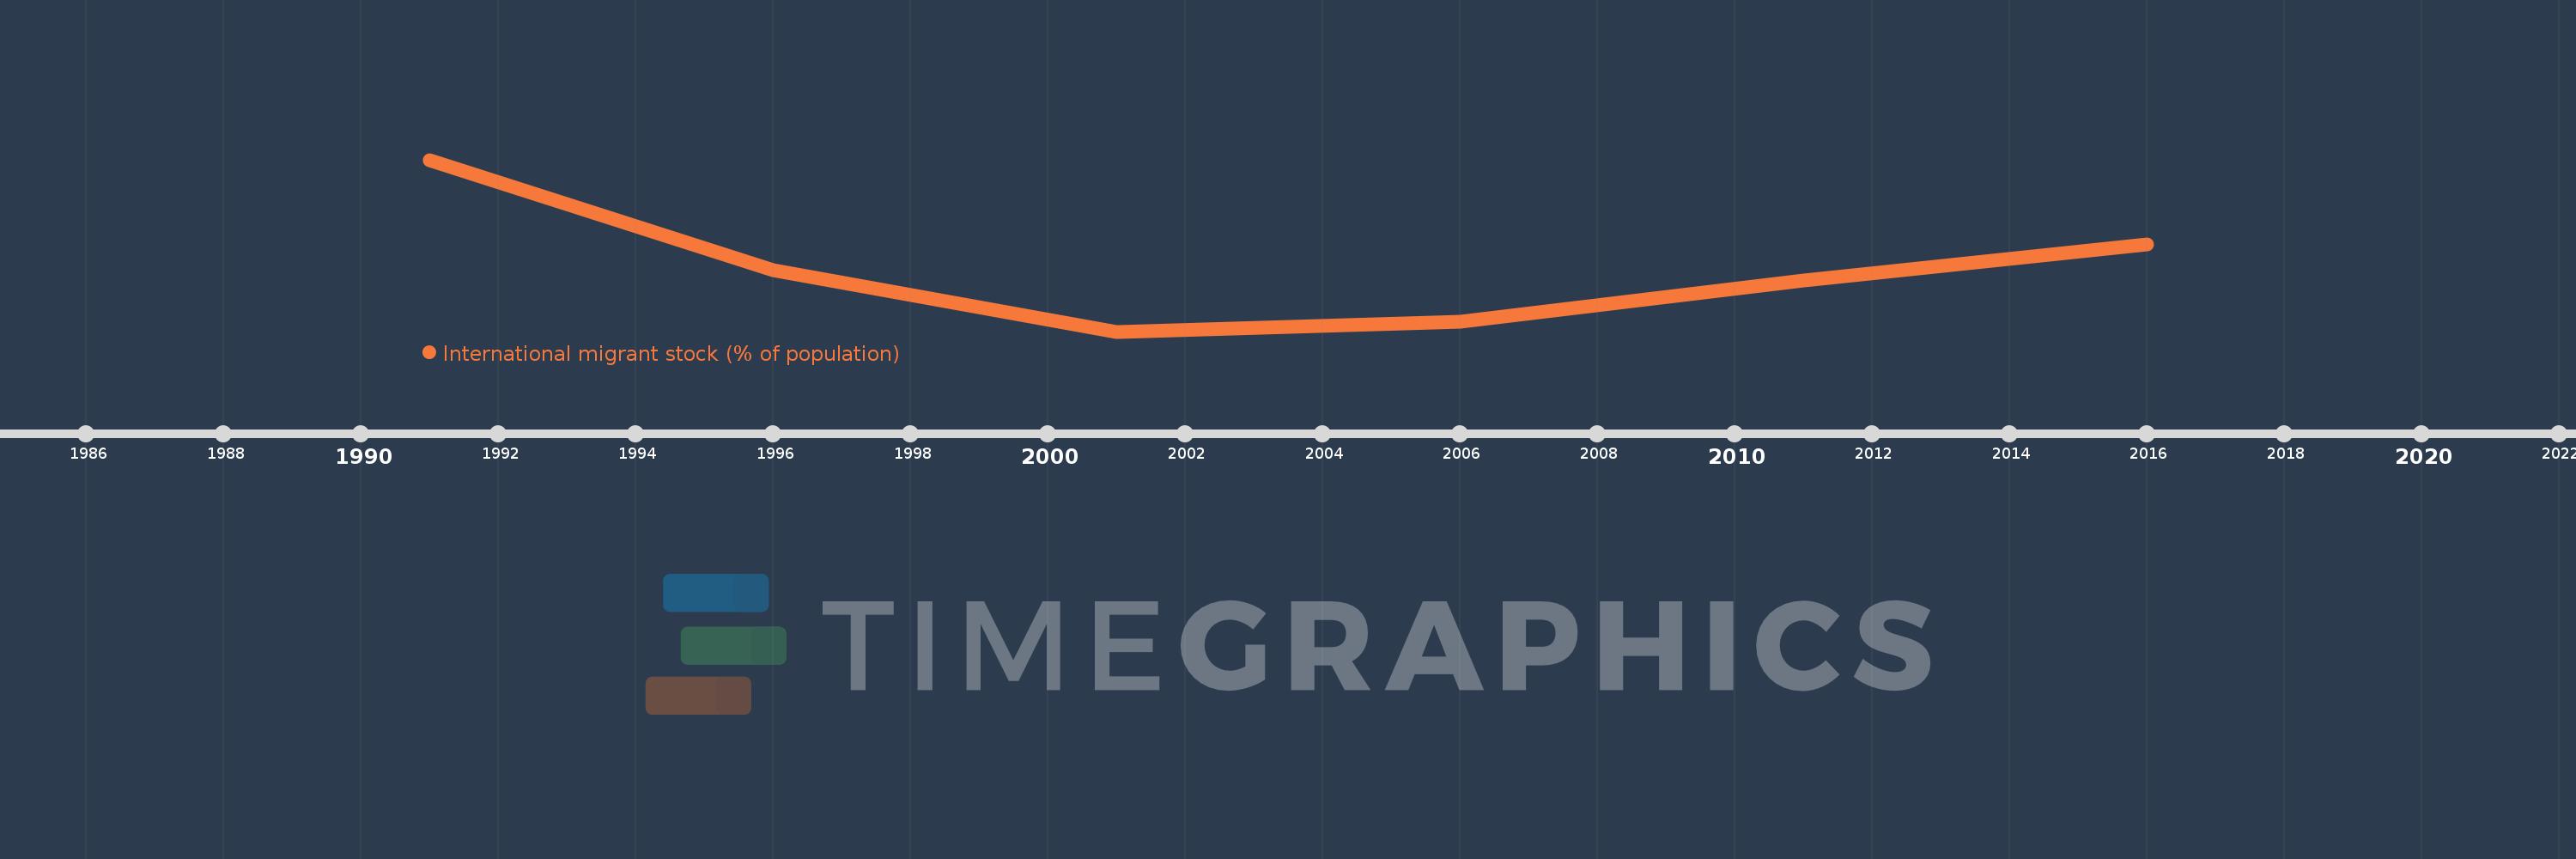
This timeline shows a graph from 1991 to 2016 of Latin America & Caribbean (excluding high income). No data until 1990. Number of actual observations by date: 6.
Source name:
World Development Indicators
Source organization:
United Nations Population Division, Trends in Total Migrant Stock: 2008 Revision.
Categories, topics:
Financial Sector, Health
Last updated:
apr 23, 2017
Indicators value changes by year
Meaning:
1.225
Minimum:
1.083
jan 1, 2001
Maximum:
1.468
jan 1, 1991
At the date of observation
Value
Absolute change
Change from the previous value
jan 1, 1991
1.468
+1.468
0.0%
jan 1, 1996
1.22
-0.248
-16.9%
jan 1, 2001
1.083
-0.137
-11.23%
jan 1, 2006
1.105
+0.022
2.06%
jan 1, 2011
1.197
+0.092
8.29%
jan 1, 2016
1.279
+0.082
6.82%
Ranking of countries by current statistics by years