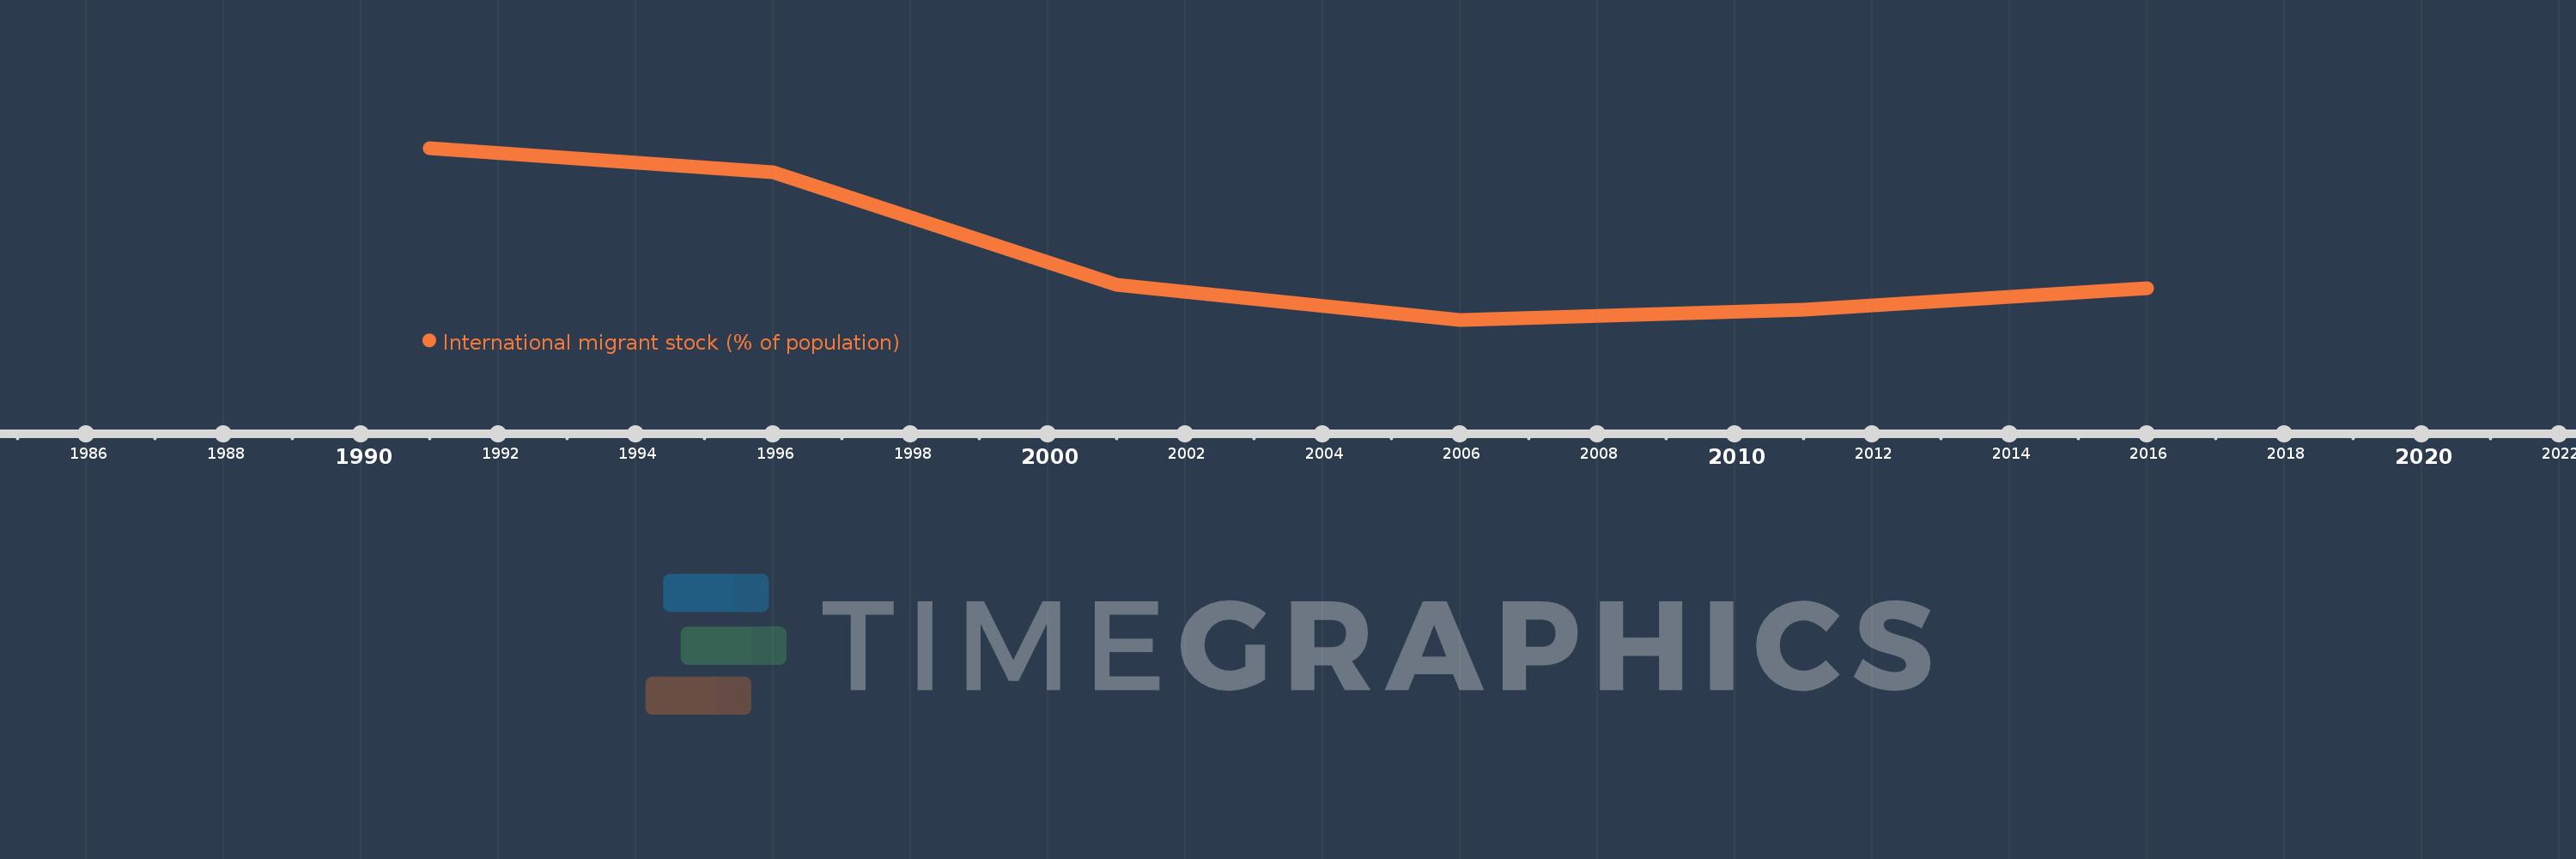
This timeline shows a graph from 1991 to 2016 of Fragile and conflict affected situations. No data until 1990. Number of actual observations by date: 6.
Source name:
World Development Indicators
Source organization:
United Nations Population Division, Trends in Total Migrant Stock: 2008 Revision.
Categories, topics:
Financial Sector, Health
Last updated:
apr 23, 2017
Indicators value changes by year
Meaning:
2.66
Minimum:
2.2
jan 1, 2006
Maximum:
3.395
jan 1, 1991
At the date of observation
Value
Absolute change
Change from the previous value
jan 1, 1991
3.395
+3.395
0.0%
jan 1, 1996
3.225
-0.17
-5.02%
jan 1, 2001
2.445
-0.78
-24.17%
jan 1, 2006
2.2
-0.245
-10.04%
jan 1, 2011
2.272
+0.072
3.25%
jan 1, 2016
2.42
+0.148
6.53%
Ranking of countries by current statistics by years