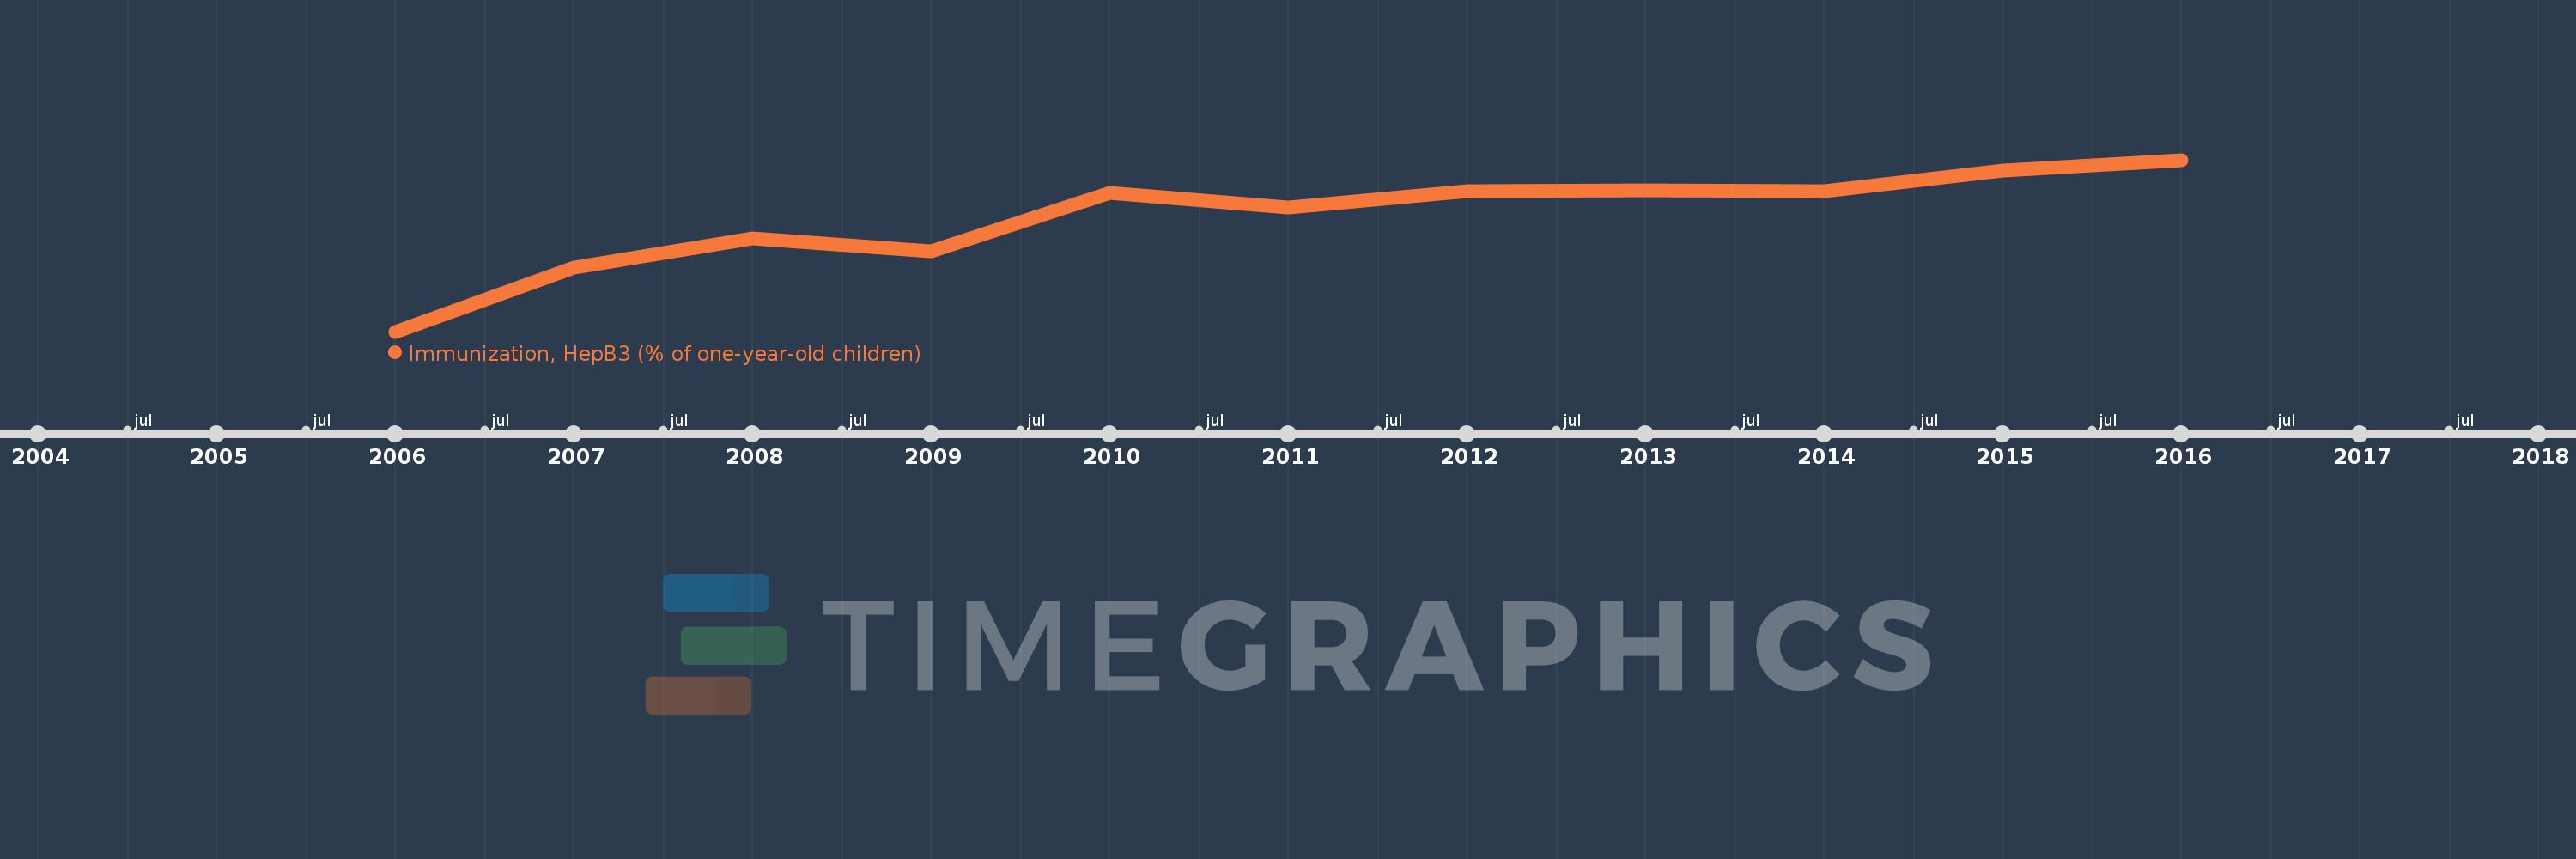
This timeline shows a graph from 2006 to 2016 of Sub-Saharan Africa (IDA & IBRD countries). No data until 2005. Number of actual observations by date: 11.
Source name:
World Development Indicators
Source organization:
WHO and UNICEF (http://www.who.int/immunization_monitoring/routine/en/).
Categories, topics:
Health
Last updated:
apr 23, 2017
Indicators value changes by year
Meaning:
69.988
Minimum:
58.391
jan 1, 2006
Maximum:
75.84
jan 1, 2016
At the date of observation
Value
Absolute change
Change from the previous value
jan 1, 2006
58.391
+58.391
0.0%
jan 1, 2007
64.934
+6.543
11.21%
jan 1, 2008
67.834
+2.9
4.47%
jan 1, 2009
66.543
-1.291
-1.9%
jan 1, 2010
72.512
+5.969
8.97%
jan 1, 2011
70.999
-1.513
-2.09%
jan 1, 2012
72.656
+1.657
2.33%
jan 1, 2013
72.746
+0.09
0.12%
jan 1, 2014
72.674
-0.073
-0.1%
jan 1, 2015
74.735
+2.062
2.84%
jan 1, 2016
75.84
+1.105
1.48%
Ranking of countries by current statistics by years