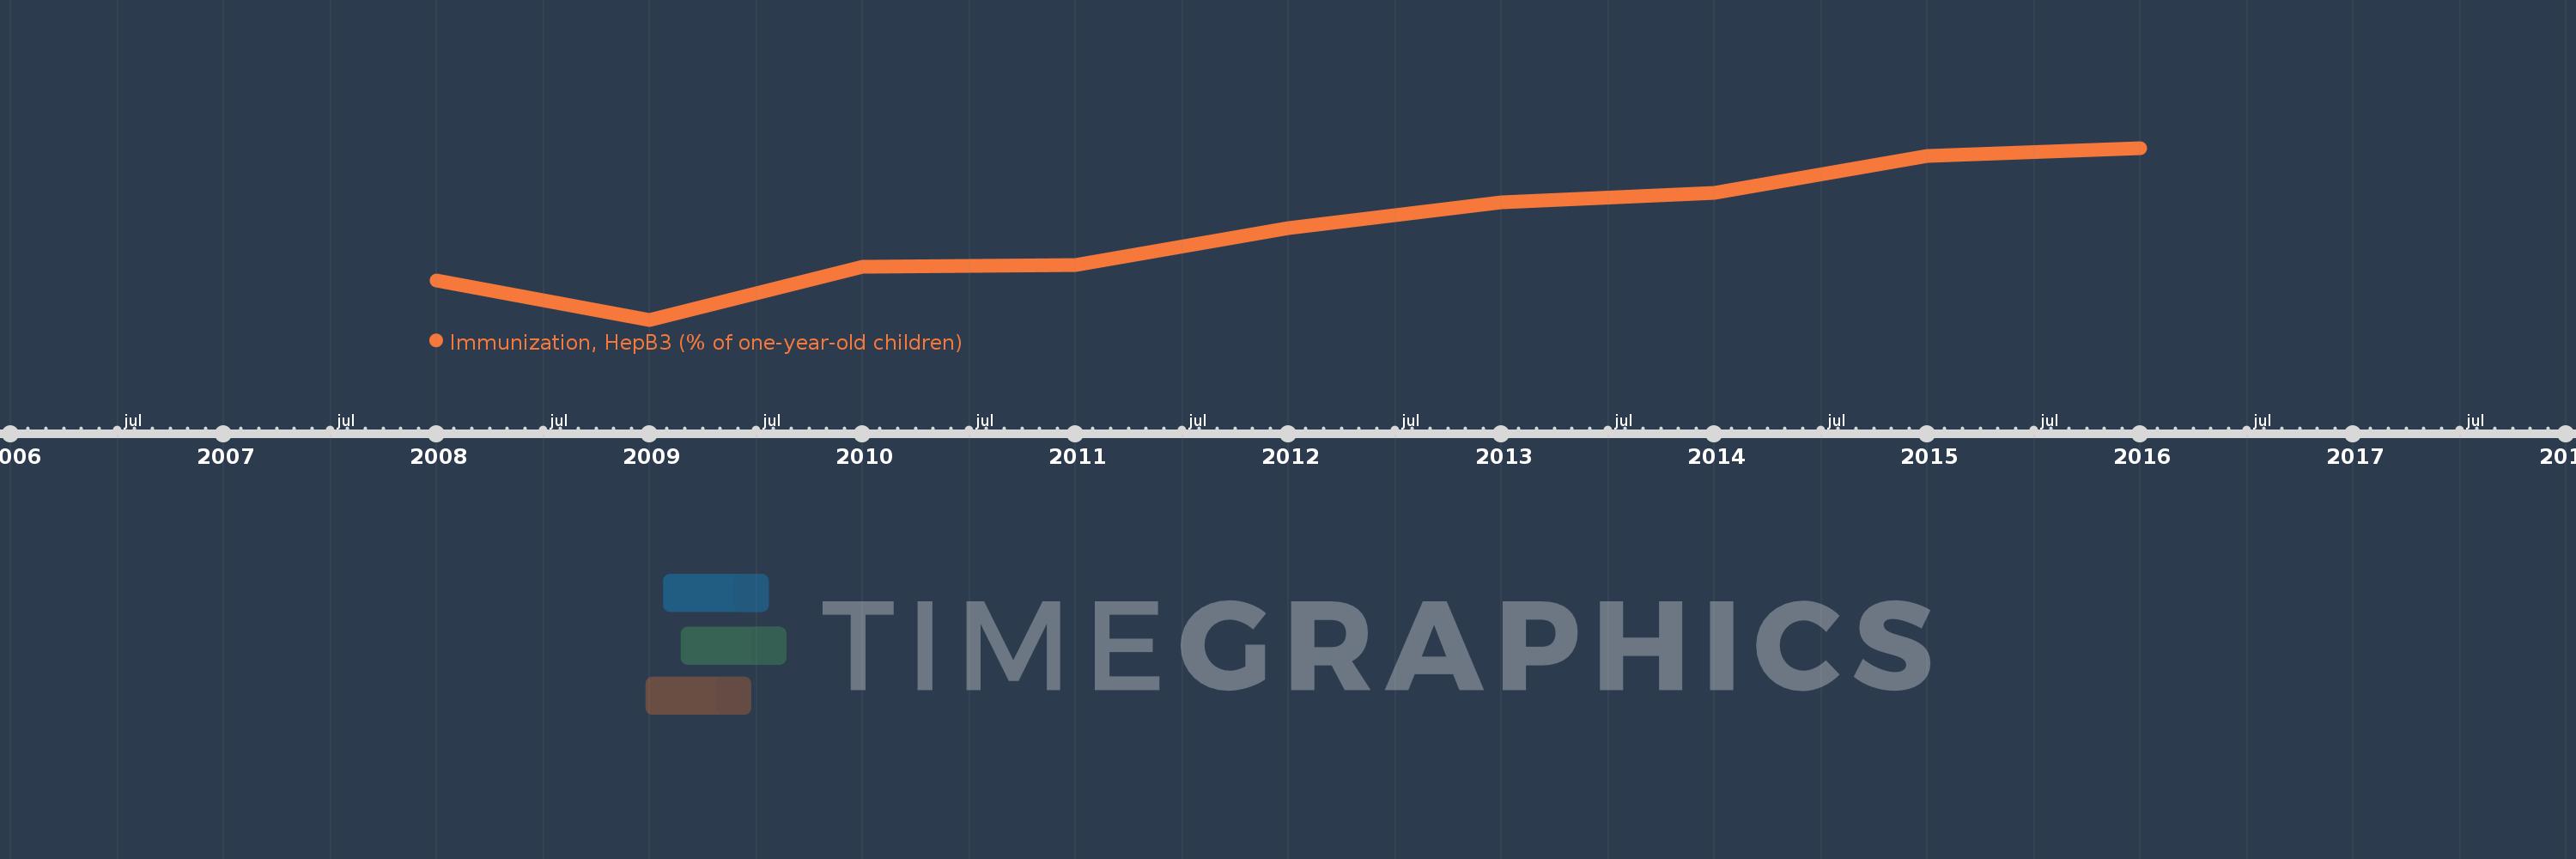
This timeline shows a graph from 2008 to 2016 of Least developed countries: UN classification. No data until 2007. Number of actual observations by date: 9.
Source name:
World Development Indicators
Source organization:
WHO and UNICEF (http://www.who.int/immunization_monitoring/routine/en/).
Categories, topics:
Health
Last updated:
apr 23, 2017
Indicators value changes by year
Meaning:
78.198
Minimum:
75.117
jan 1, 2009
Maximum:
80.938
jan 1, 2016
At the date of observation
Value
Absolute change
Change from the previous value
jan 1, 2008
76.433
+76.433
0.0%
jan 1, 2009
75.117
-1.316
-1.72%
jan 1, 2010
76.918
+1.801
2.4%
jan 1, 2011
76.985
+0.067
0.09%
jan 1, 2012
78.215
+1.23
1.6%
jan 1, 2013
79.092
+0.877
1.12%
jan 1, 2014
79.429
+0.337
0.43%
jan 1, 2015
80.656
+1.227
1.54%
jan 1, 2016
80.938
+0.282
0.35%
Ranking of countries by current statistics by years