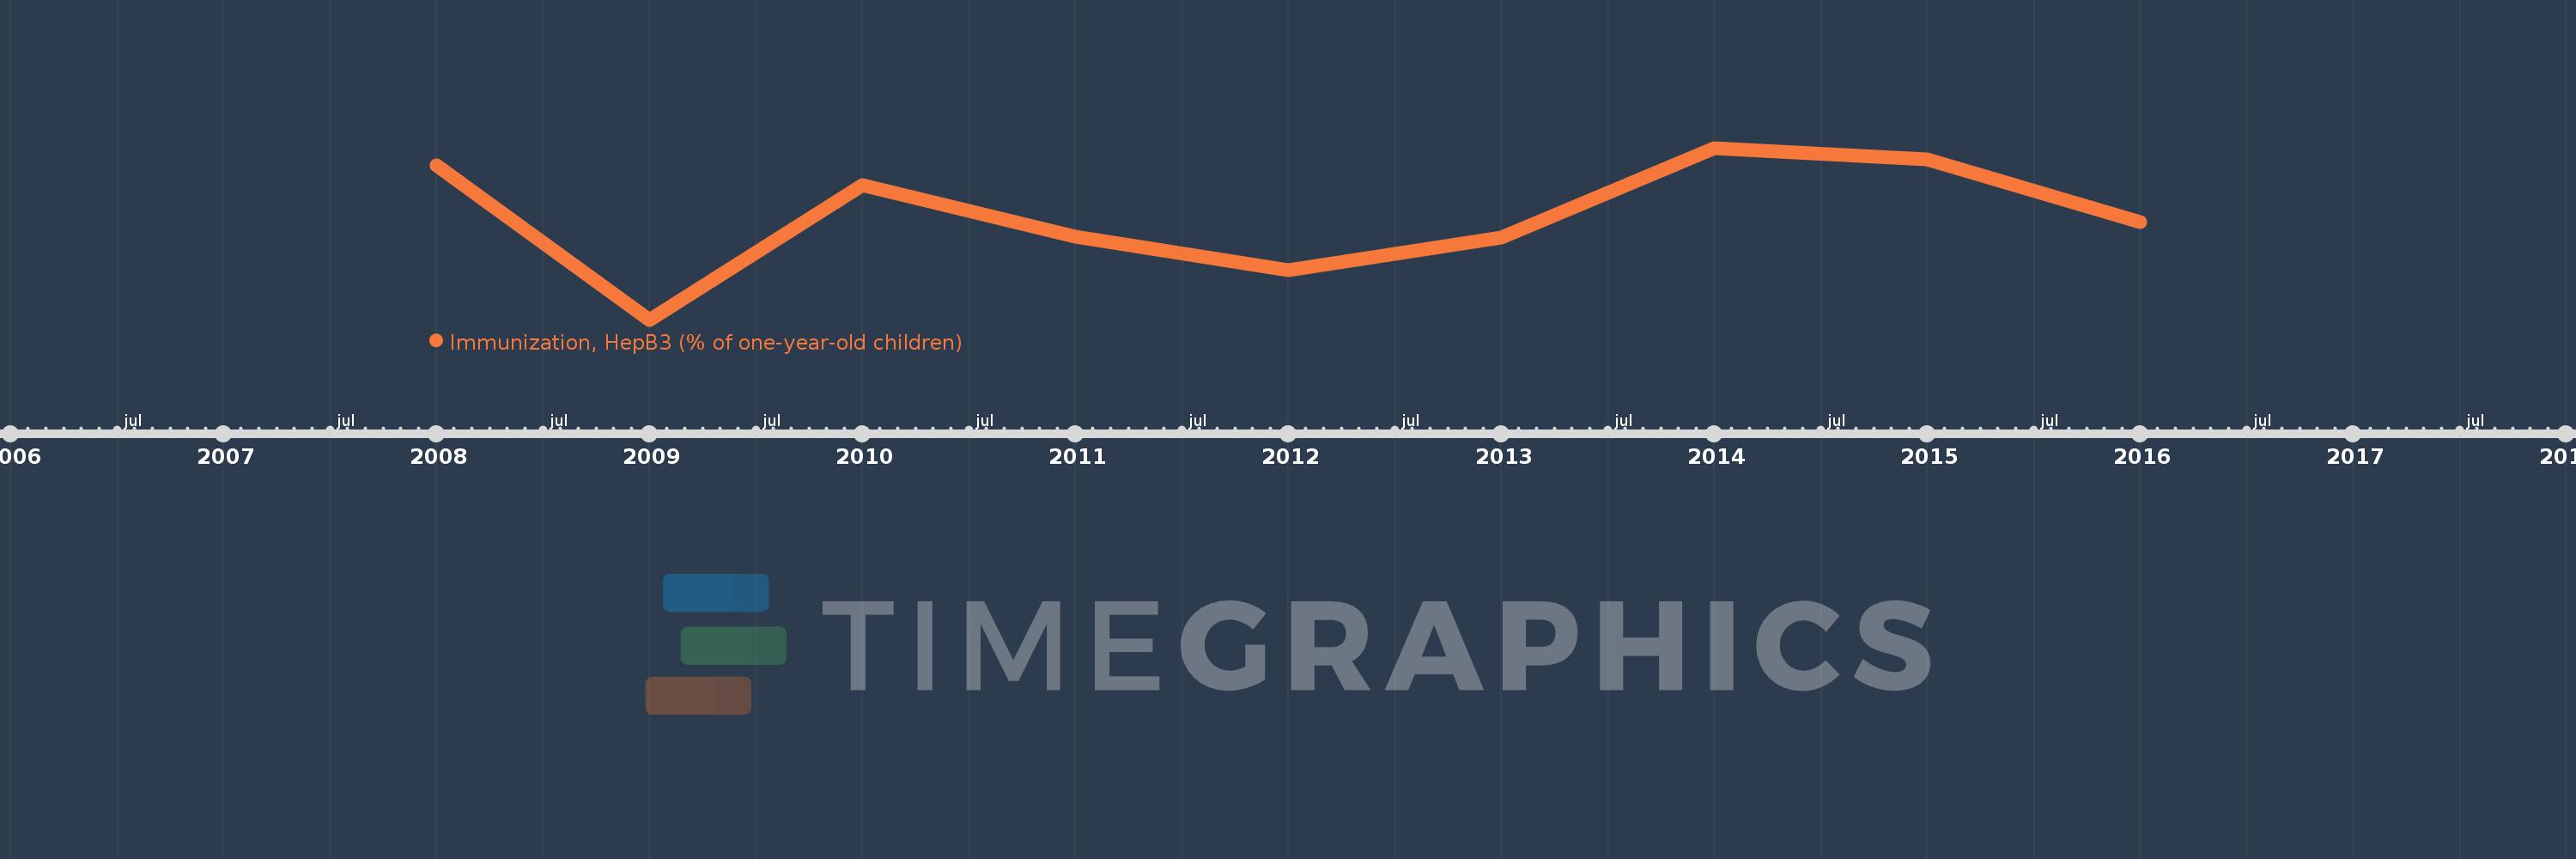
This timeline shows a graph from 2008 to 2016 of Fragile and conflict affected situations. No data until 2007. Number of actual observations by date: 9.
Source name:
World Development Indicators
Source organization:
WHO and UNICEF (http://www.who.int/immunization_monitoring/routine/en/).
Categories, topics:
Health
Last updated:
apr 23, 2017
Indicators value changes by year
Meaning:
73.096
Minimum:
70.631
jan 1, 2009
Maximum:
74.712
jan 1, 2014
At the date of observation
Value
Absolute change
Change from the previous value
jan 1, 2008
74.305
+74.305
0.0%
jan 1, 2009
70.631
-3.674
-4.94%
jan 1, 2010
73.825
+3.194
4.52%
jan 1, 2011
72.603
-1.222
-1.65%
jan 1, 2012
71.802
-0.802
-1.1%
jan 1, 2013
72.588
+0.786
1.1%
jan 1, 2014
74.712
+2.124
2.93%
jan 1, 2015
74.45
-0.262
-0.35%
jan 1, 2016
72.948
-1.502
-2.02%
Ranking of countries by current statistics by years