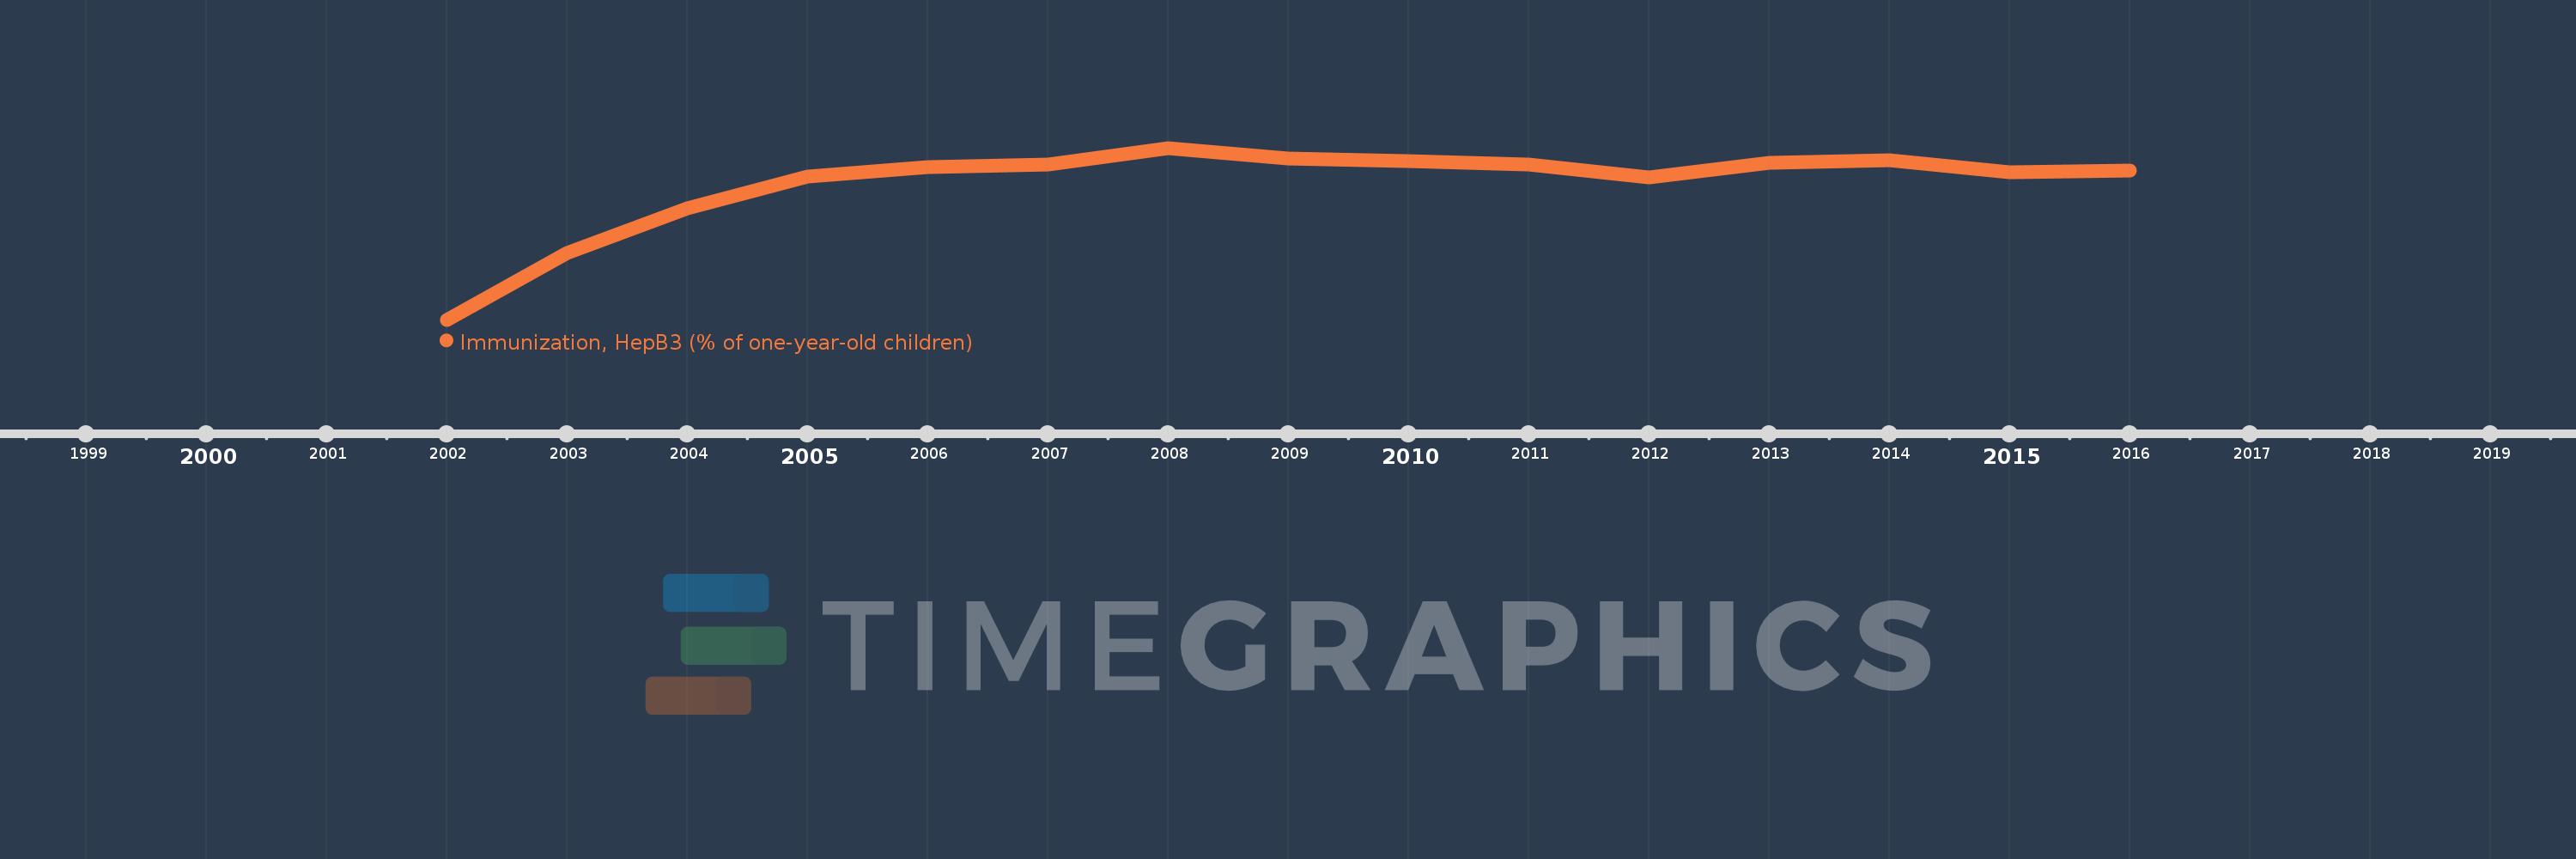
This timeline shows a graph from 2002 to 2016 of Europe & Central Asia (IDA & IBRD countries). No data until 2001. Number of actual observations by date: 15.
Source name:
World Development Indicators
Source organization:
WHO and UNICEF (http://www.who.int/immunization_monitoring/routine/en/).
Categories, topics:
Health
Last updated:
apr 23, 2017
Indicators value changes by year
Meaning:
88.609
Minimum:
63.612
jan 1, 2002
Maximum:
95.326
jan 1, 2008
At the date of observation
Value
Absolute change
Change from the previous value
jan 1, 2002
63.612
+63.612
0.0%
jan 1, 2003
75.864
+12.252
19.26%
jan 1, 2004
84.203
+8.339
10.99%
jan 1, 2005
89.996
+5.793
6.88%
jan 1, 2006
91.768
+1.771
1.97%
jan 1, 2007
92.306
+0.539
0.59%
jan 1, 2008
95.326
+3.02
3.27%
jan 1, 2009
93.454
-1.872
-1.96%
jan 1, 2010
92.973
-0.481
-0.51%
jan 1, 2011
92.269
-0.705
-0.76%
jan 1, 2012
89.874
-2.395
-2.6%
jan 1, 2013
92.532
+2.658
2.96%
jan 1, 2014
93.019
+0.487
0.53%
jan 1, 2015
90.844
-2.175
-2.34%
jan 1, 2016
91.098
+0.254
0.28%
Ranking of countries by current statistics by years