This timeline shows a graph from 2001 to 2016 of 
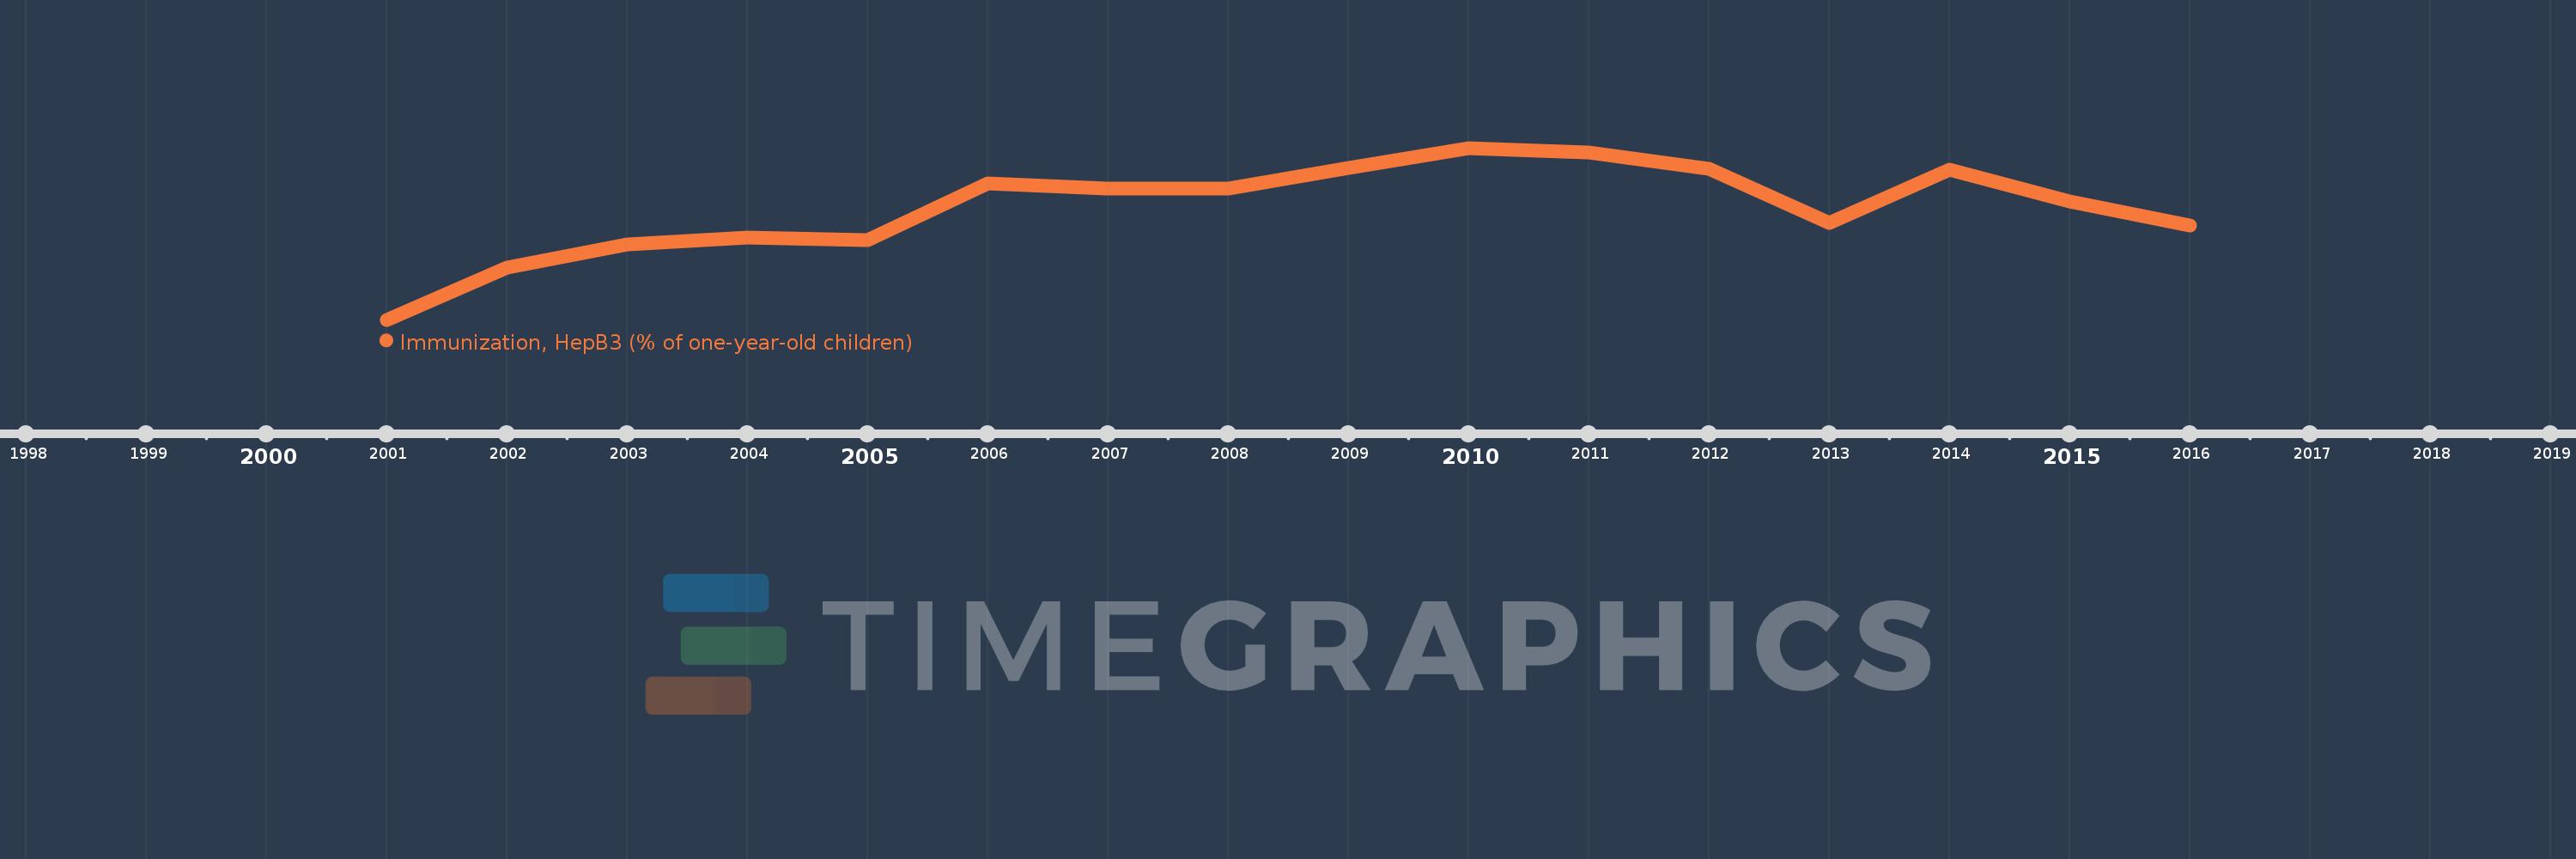
Middle East & North Africa (excluding high income). No data until 2000. Number of actual observations by date: 16.
Source name:
World Development Indicators
Source organization:
WHO and UNICEF (http://www.who.int/immunization_monitoring/routine/en/).
Categories, topics:
Health
Last updated:
apr 23, 2017
Indicators value changes by year
Meaning:
86.157
Minimum:
77.136
jan 1, 2001
Maximum:
91.001
jan 1, 2010
At the date of observation
Value
Absolute change
Change from the previous value
jan 1, 2001
77.136
+77.136
0.0%
jan 1, 2002
81.355
+4.219
5.47%
jan 1, 2003
83.205
+1.85
2.27%
jan 1, 2004
83.738
+0.533
0.64%
jan 1, 2005
83.53
-0.209
-0.25%
jan 1, 2006
88.13
+4.6
5.51%
jan 1, 2007
87.71
-0.419
-0.48%
jan 1, 2008
87.756
+0.046
0.05%
jan 1, 2009
89.392
+1.636
1.86%
jan 1, 2010
91.001
+1.609
1.8%
jan 1, 2011
90.623
-0.378
-0.42%
jan 1, 2012
89.295
-1.328
-1.47%
jan 1, 2013
84.958
-4.338
-4.86%
jan 1, 2014
89.273
+4.315
5.08%
jan 1, 2015
86.652
-2.622
-2.94%
jan 1, 2016
84.76
-1.891
-2.18%
Ranking of countries by current statistics by years