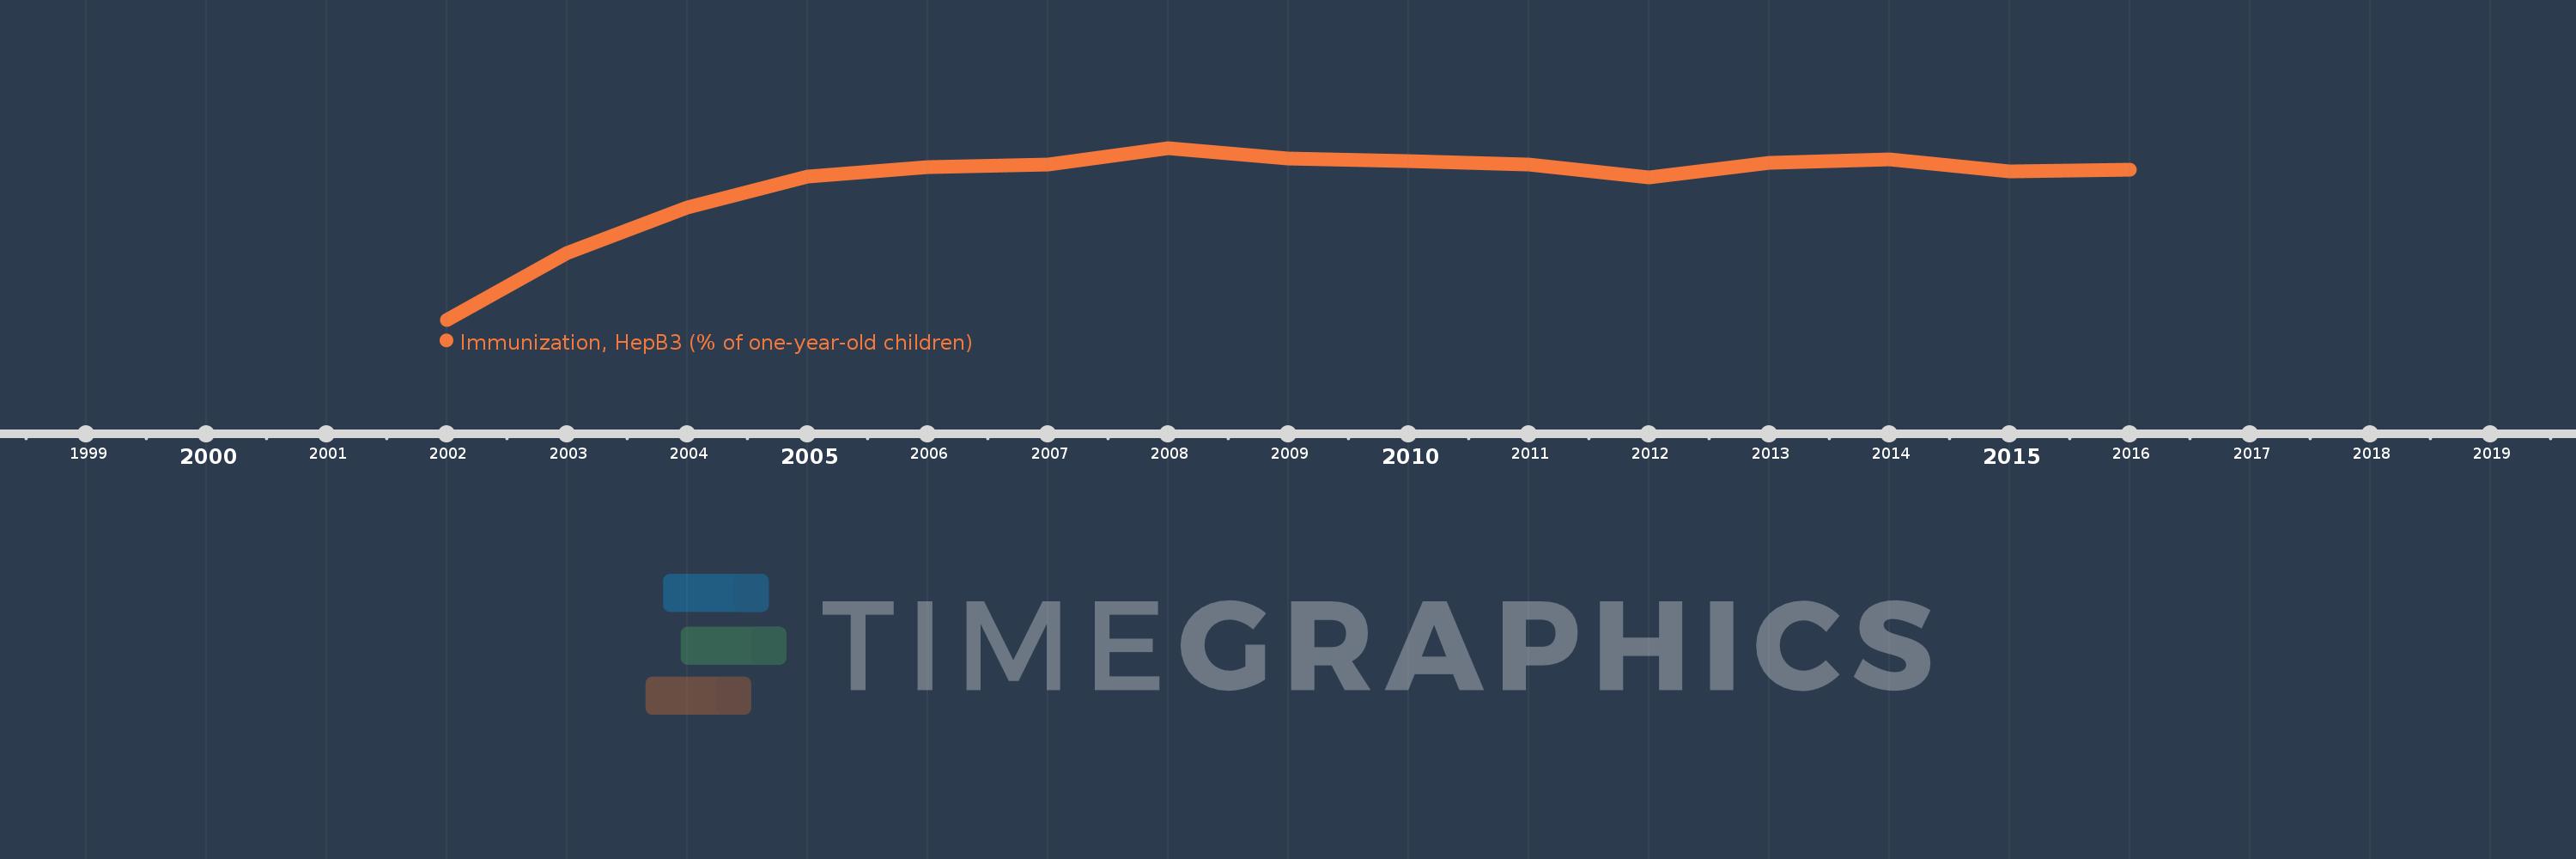
This timeline shows a graph from 2002 to 2016 of Europe & Central Asia (excluding high income). No data until 2001. Number of actual observations by date: 15.
Source name:
World Development Indicators
Source organization:
WHO and UNICEF (http://www.who.int/immunization_monitoring/routine/en/).
Categories, topics:
Health
Last updated:
apr 23, 2017
Indicators value changes by year
Meaning:
87.943
Minimum:
60.874
jan 1, 2002
Maximum:
95.137
jan 1, 2008
At the date of observation
Value
Absolute change
Change from the previous value
jan 1, 2002
60.874
+60.874
0.0%
jan 1, 2003
74.256
+13.383
21.98%
jan 1, 2004
83.288
+9.032
12.16%
jan 1, 2005
89.443
+6.155
7.39%
jan 1, 2006
91.337
+1.894
2.12%
jan 1, 2007
91.912
+0.575
0.63%
jan 1, 2008
95.137
+3.225
3.51%
jan 1, 2009
93.091
-2.045
-2.15%
jan 1, 2010
92.566
-0.525
-0.56%
jan 1, 2011
91.805
-0.761
-0.82%
jan 1, 2012
89.197
-2.608
-2.84%
jan 1, 2013
92.179
+2.982
3.34%
jan 1, 2014
92.799
+0.62
0.67%
jan 1, 2015
90.485
-2.314
-2.49%
jan 1, 2016
90.772
+0.288
0.32%
Ranking of countries by current statistics by years