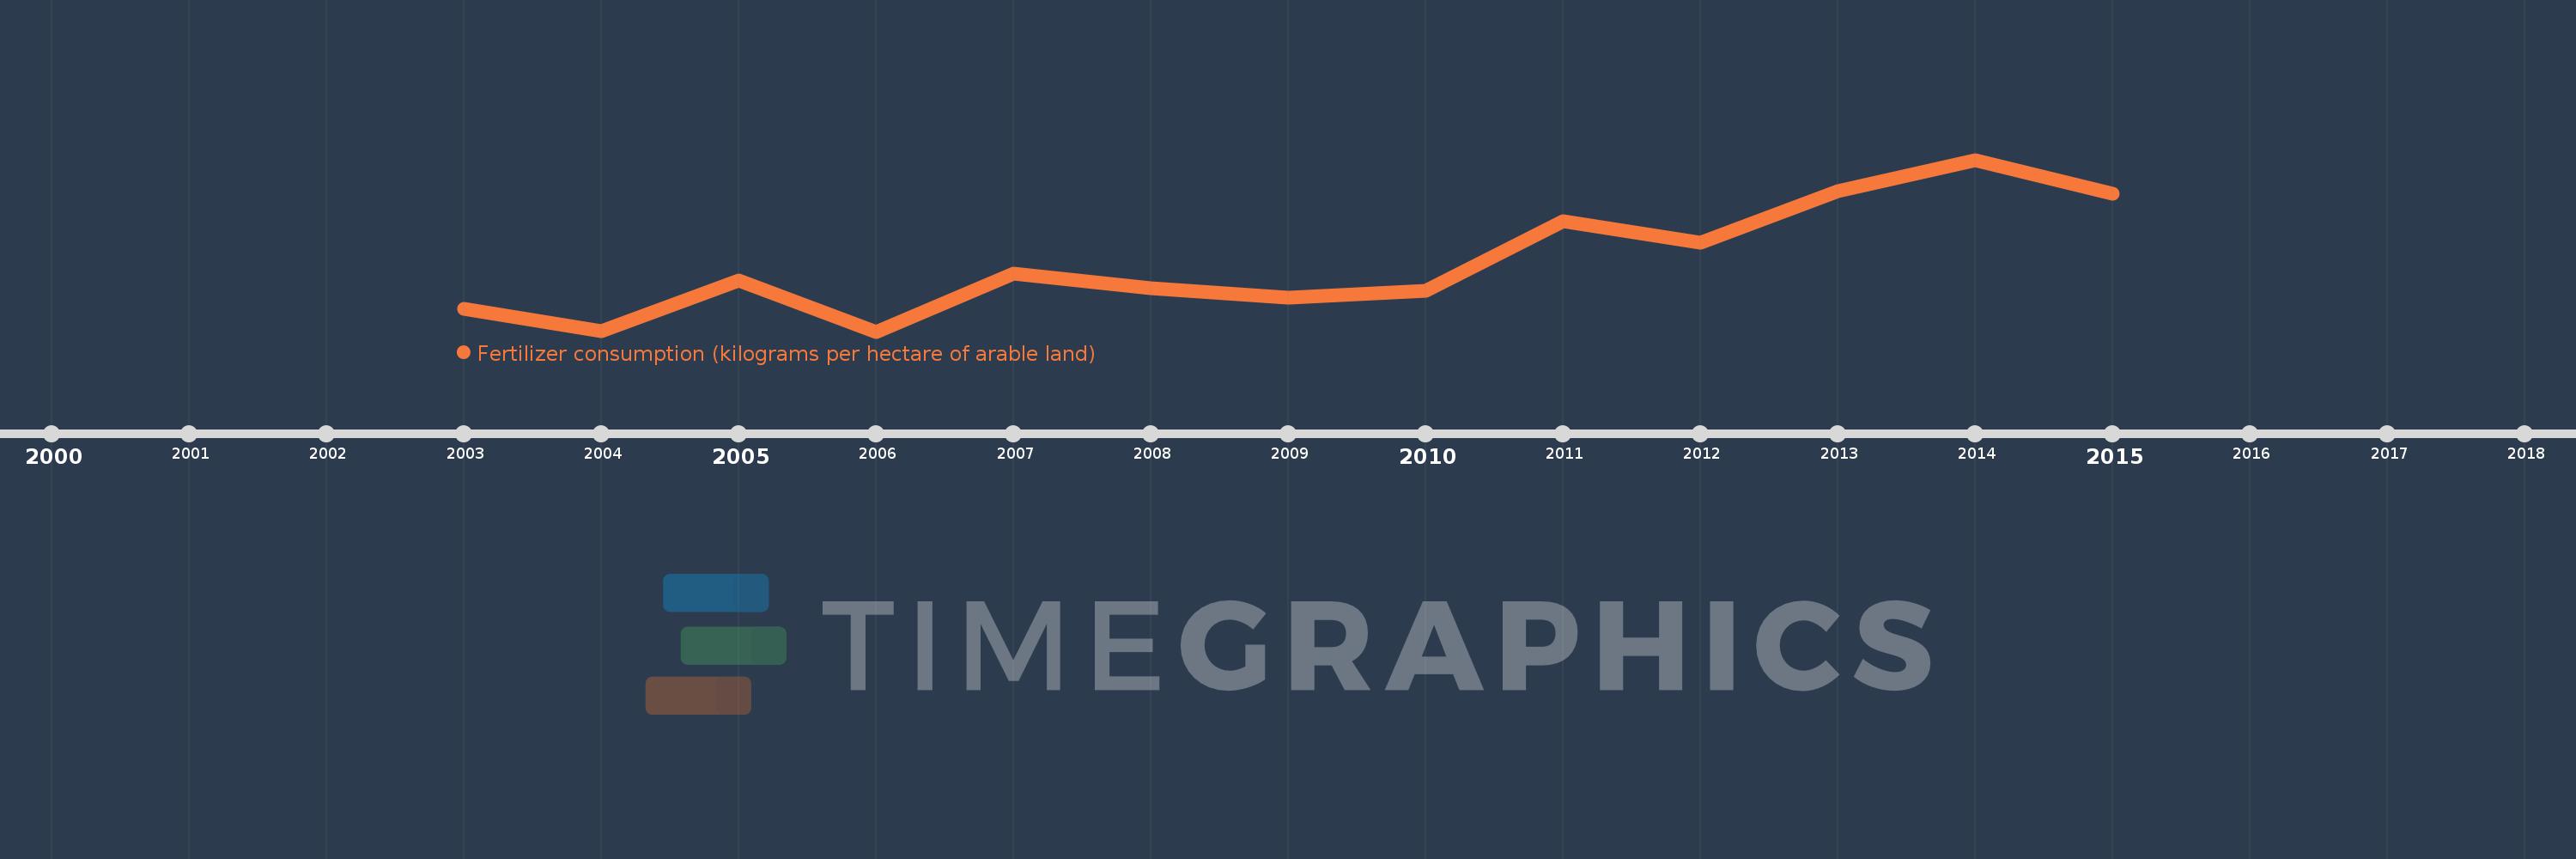
This timeline shows a graph from 2003 to 2015 of Sub-Saharan Africa (IDA & IBRD countries). No data until 2002. Number of actual observations by date: 13.
Source name:
World Development Indicators
Source organization:
Food and Agriculture Organization, electronic files and web site.
Categories, topics:
Agriculture & Rural Development
Last updated:
apr 23, 2017
Indicators value changes by year
Meaning:
13.483
Minimum:
10.949
jan 1, 2006
Maximum:
17.24
jan 1, 2014
At the date of observation
Value
Absolute change
Change from the previous value
jan 1, 2003
11.788
+11.788
0.0%
jan 1, 2004
10.977
-0.811
-6.88%
jan 1, 2005
12.82
+1.844
16.79%
jan 1, 2006
10.949
-1.871
-14.6%
jan 1, 2007
13.057
+2.108
19.25%
jan 1, 2008
12.532
-0.525
-4.02%
jan 1, 2009
12.207
-0.324
-2.59%
jan 1, 2010
12.432
+0.224
1.84%
jan 1, 2011
14.985
+2.554
20.54%
jan 1, 2012
14.198
-0.787
-5.25%
jan 1, 2013
16.102
+1.903
13.41%
jan 1, 2014
17.24
+1.138
7.07%
jan 1, 2015
15.986
-1.254
-7.27%
Ranking of countries by current statistics by years