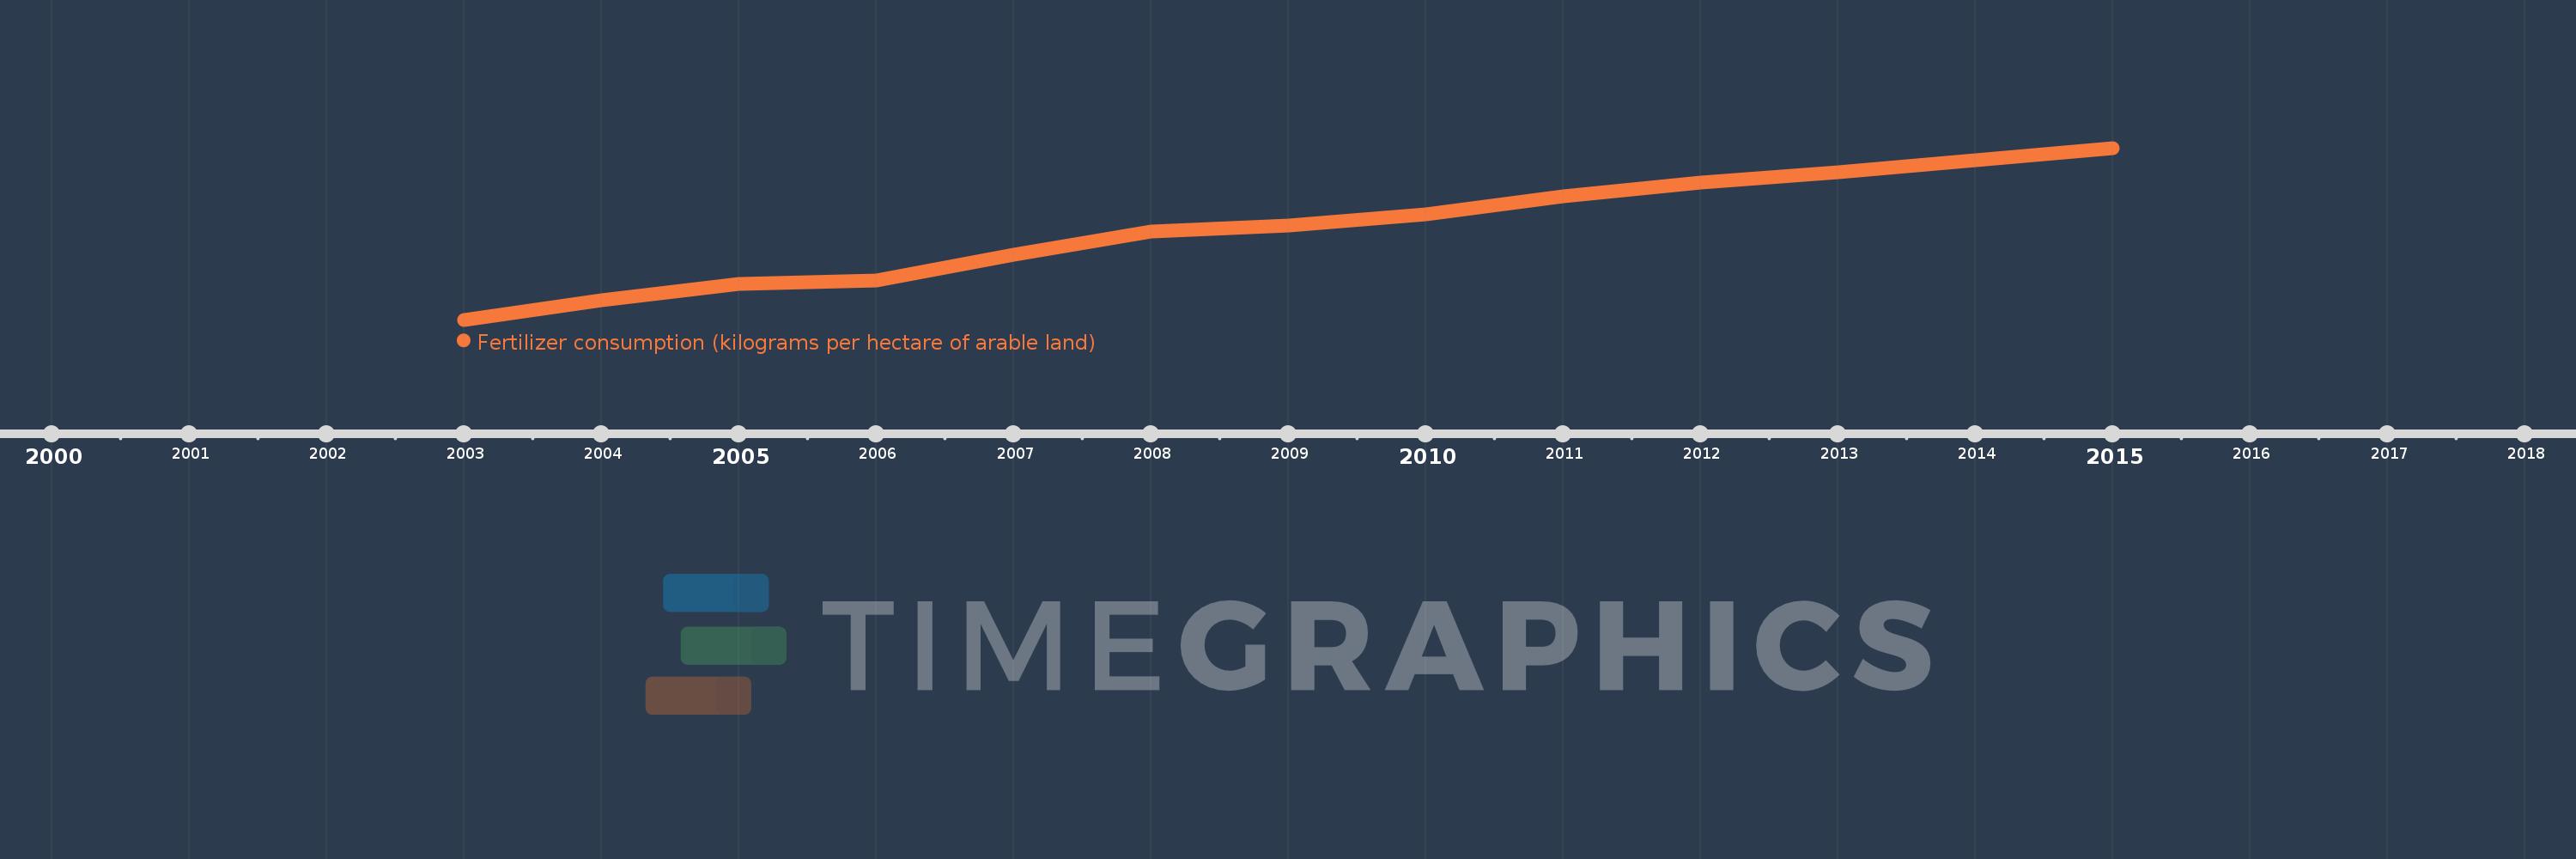
This timeline shows a graph from 2003 to 2015 of East Asia & Pacific (IDA & IBRD countries). No data until 2002. Number of actual observations by date: 13.
Source name:
World Development Indicators
Source organization:
Food and Agriculture Organization, electronic files and web site.
Categories, topics:
Agriculture & Rural Development
Last updated:
apr 23, 2017
Indicators value changes by year
Meaning:
358.581
Minimum:
289.816
jan 1, 2003
Maximum:
419.296
jan 1, 2015
At the date of observation
Value
Absolute change
Change from the previous value
jan 1, 2003
289.816
+289.816
0.0%
jan 1, 2004
304.495
+14.679
5.06%
jan 1, 2005
316.618
+12.123
3.98%
jan 1, 2006
319.156
+2.538
0.8%
jan 1, 2007
338.872
+19.716
6.18%
jan 1, 2008
356.047
+17.175
5.07%
jan 1, 2009
360.521
+4.474
1.26%
jan 1, 2010
369.221
+8.7
2.41%
jan 1, 2011
383.04
+13.818
3.74%
jan 1, 2012
393.121
+10.082
2.63%
jan 1, 2013
401.181
+8.06
2.05%
jan 1, 2014
410.164
+8.983
2.24%
jan 1, 2015
419.296
+9.132
2.23%
Ranking of countries by current statistics by years