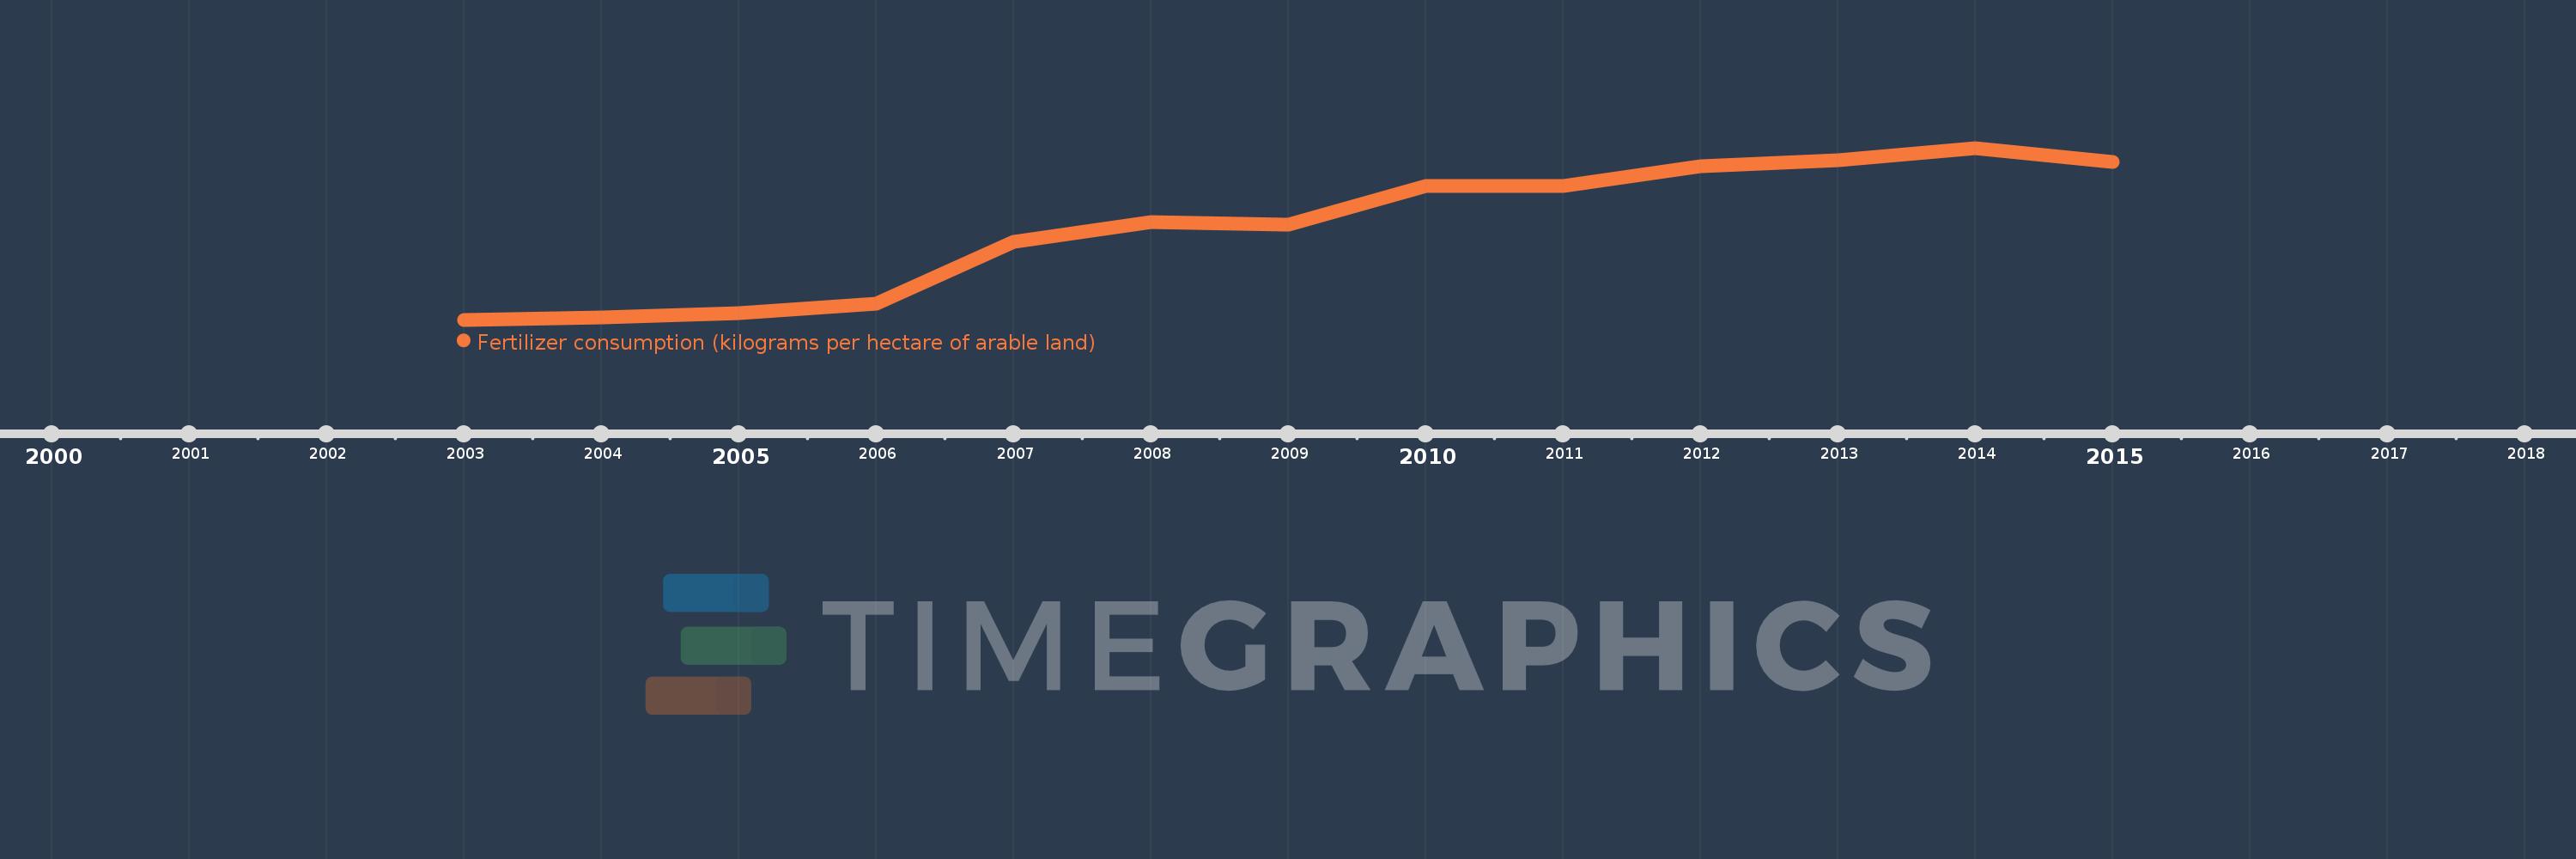
This timeline shows a graph from 2003 to 2015 of Europe & Central Asia (excluding high income). No data until 2002. Number of actual observations by date: 13.
Source name:
World Development Indicators
Source organization:
Food and Agriculture Organization, electronic files and web site.
Categories, topics:
Agriculture & Rural Development
Last updated:
apr 23, 2017
Indicators value changes by year
Meaning:
33.454
Minimum:
23.403
jan 1, 2003
Maximum:
42.005
jan 1, 2014
At the date of observation
Value
Absolute change
Change from the previous value
jan 1, 2003
23.403
+23.403
0.0%
jan 1, 2004
23.657
+0.253
1.08%
jan 1, 2005
24.122
+0.465
1.97%
jan 1, 2006
25.185
+1.064
4.41%
jan 1, 2007
31.811
+6.626
26.31%
jan 1, 2008
33.936
+2.125
6.68%
jan 1, 2009
33.725
-0.211
-0.62%
jan 1, 2010
37.91
+4.185
12.41%
jan 1, 2011
37.885
-0.025
-0.07%
jan 1, 2012
40.063
+2.178
5.75%
jan 1, 2013
40.705
+0.642
1.6%
jan 1, 2014
42.005
+1.299
3.19%
jan 1, 2015
40.488
-1.516
-3.61%
Ranking of countries by current statistics by years