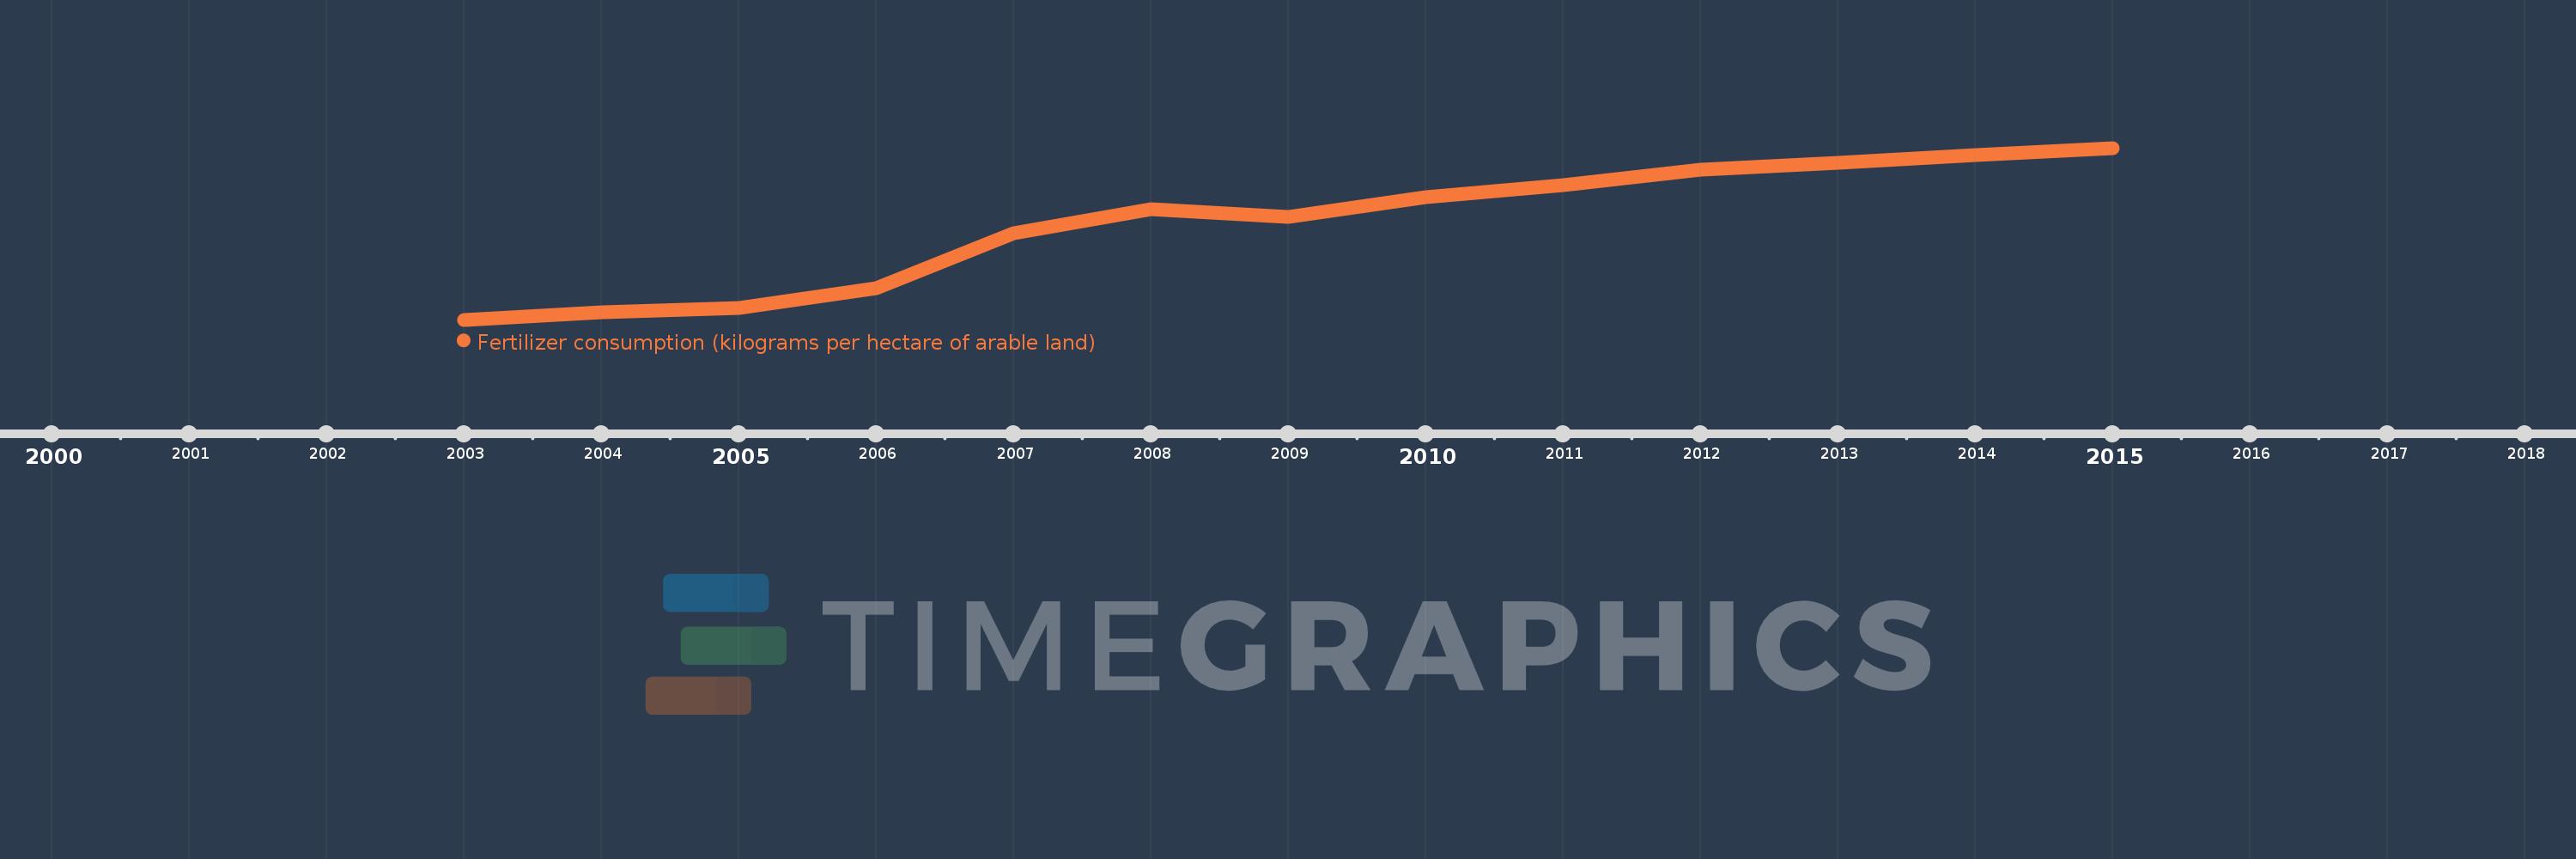
This timeline shows a graph from 2003 to 2015 of Europe & Central Asia (IDA & IBRD countries). No data until 2002. Number of actual observations by date: 13.
Source name:
World Development Indicators
Source organization:
Food and Agriculture Organization, electronic files and web site.
Categories, topics:
Agriculture & Rural Development
Last updated:
apr 23, 2017
Indicators value changes by year
Meaning:
40.458
Minimum:
28.941
jan 1, 2003
Maximum:
49.488
jan 1, 2015
At the date of observation
Value
Absolute change
Change from the previous value
jan 1, 2003
28.941
+28.941
0.0%
jan 1, 2004
29.832
+0.891
3.08%
jan 1, 2005
30.359
+0.527
1.77%
jan 1, 2006
32.755
+2.396
7.89%
jan 1, 2007
39.281
+6.526
19.92%
jan 1, 2008
42.169
+2.888
7.35%
jan 1, 2009
41.28
-0.889
-2.11%
jan 1, 2010
43.621
+2.341
5.67%
jan 1, 2011
45.088
+1.468
3.36%
jan 1, 2012
46.854
+1.766
3.92%
jan 1, 2013
47.677
+0.823
1.76%
jan 1, 2014
48.612
+0.934
1.96%
jan 1, 2015
49.488
+0.876
1.8%
Ranking of countries by current statistics by years