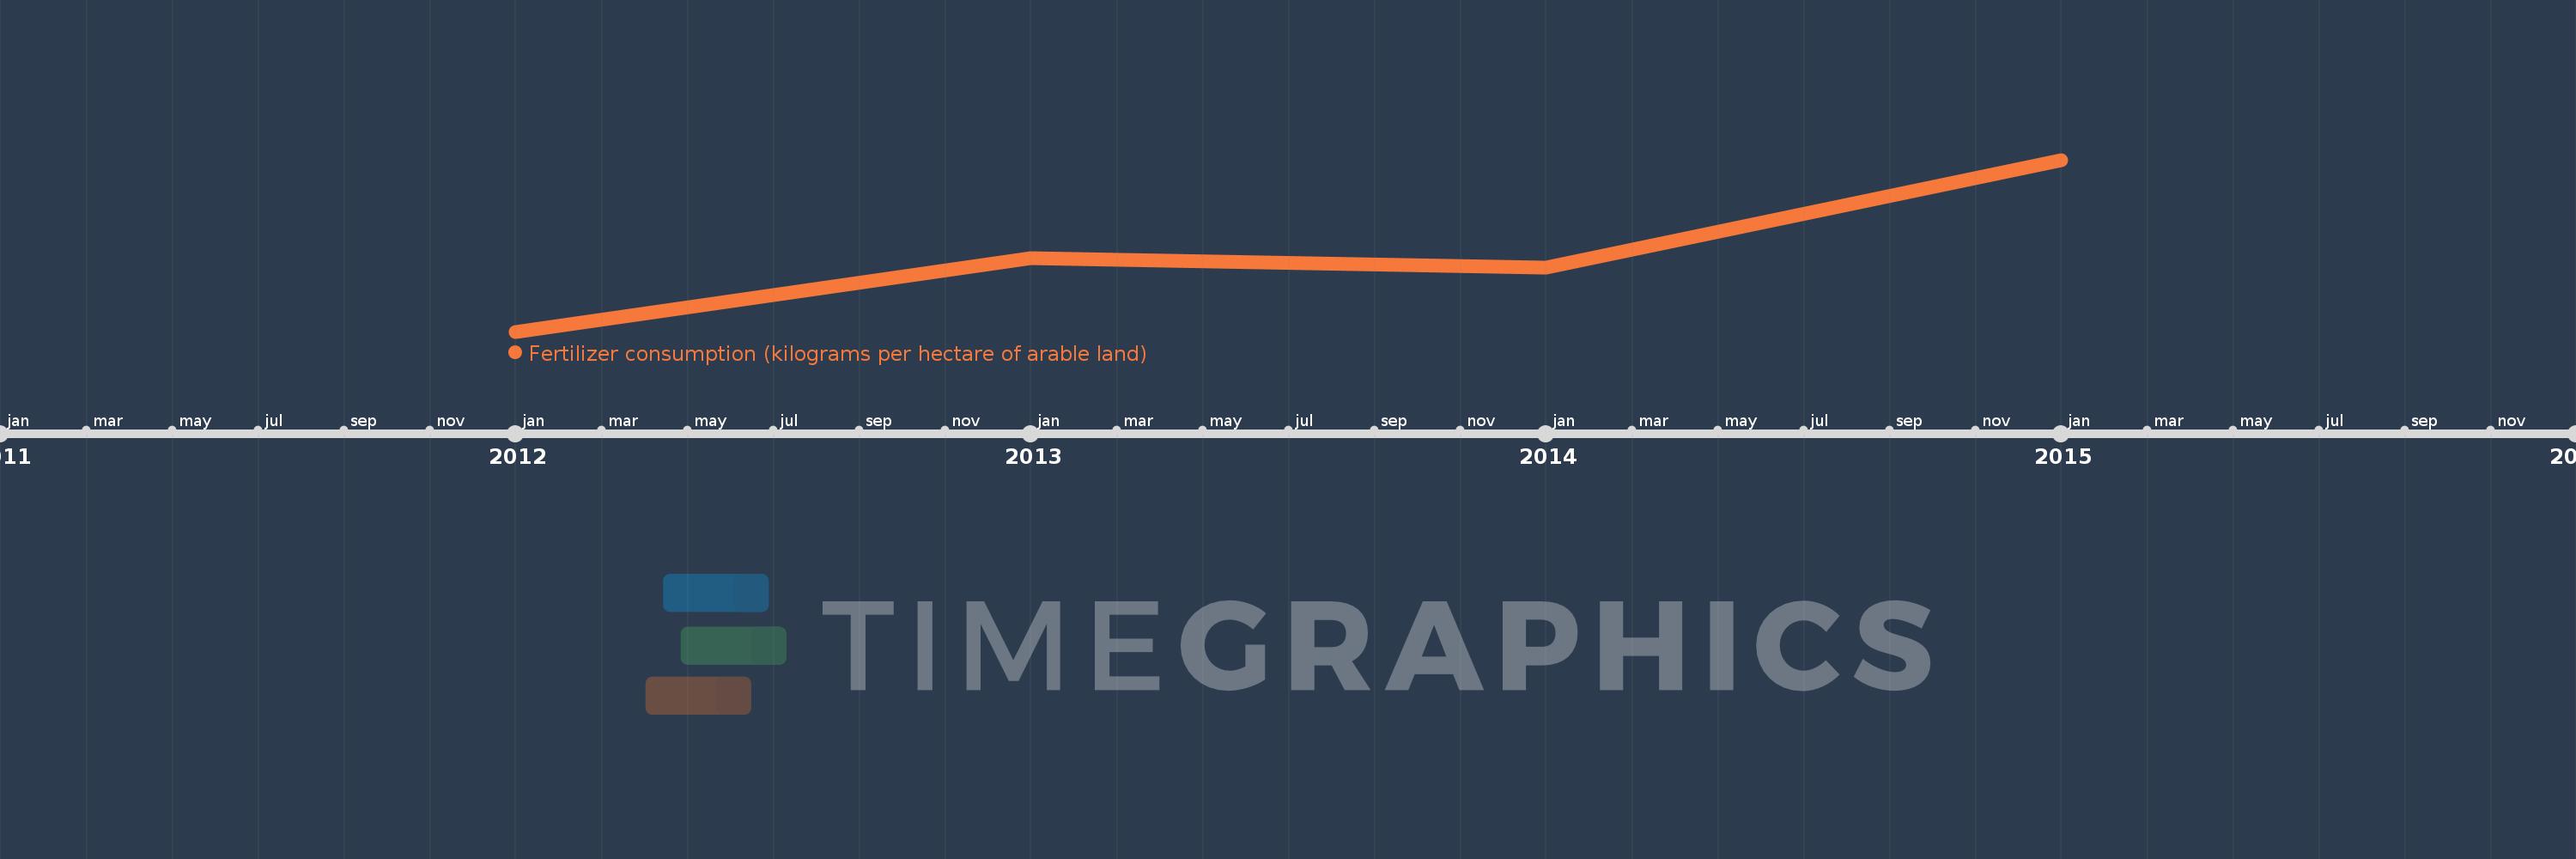
This timeline shows a graph from 2012 to 2015 of Least developed countries: UN classification. No data until 2011. Number of actual observations by date: 4.
Source name:
World Development Indicators
Source organization:
Food and Agriculture Organization, electronic files and web site.
Categories, topics:
Agriculture & Rural Development
Last updated:
apr 23, 2017
Indicators value changes by year
Meaning:
24.449
Minimum:
22.566
jan 1, 2012
Maximum:
26.749
jan 1, 2015
At the date of observation
Value
Absolute change
Change from the previous value
jan 1, 2012
22.566
+22.566
0.0%
jan 1, 2013
24.357
+1.791
7.94%
jan 1, 2014
24.126
-0.231
-0.95%
jan 1, 2015
26.749
+2.623
10.87%
Ranking of countries by current statistics by years