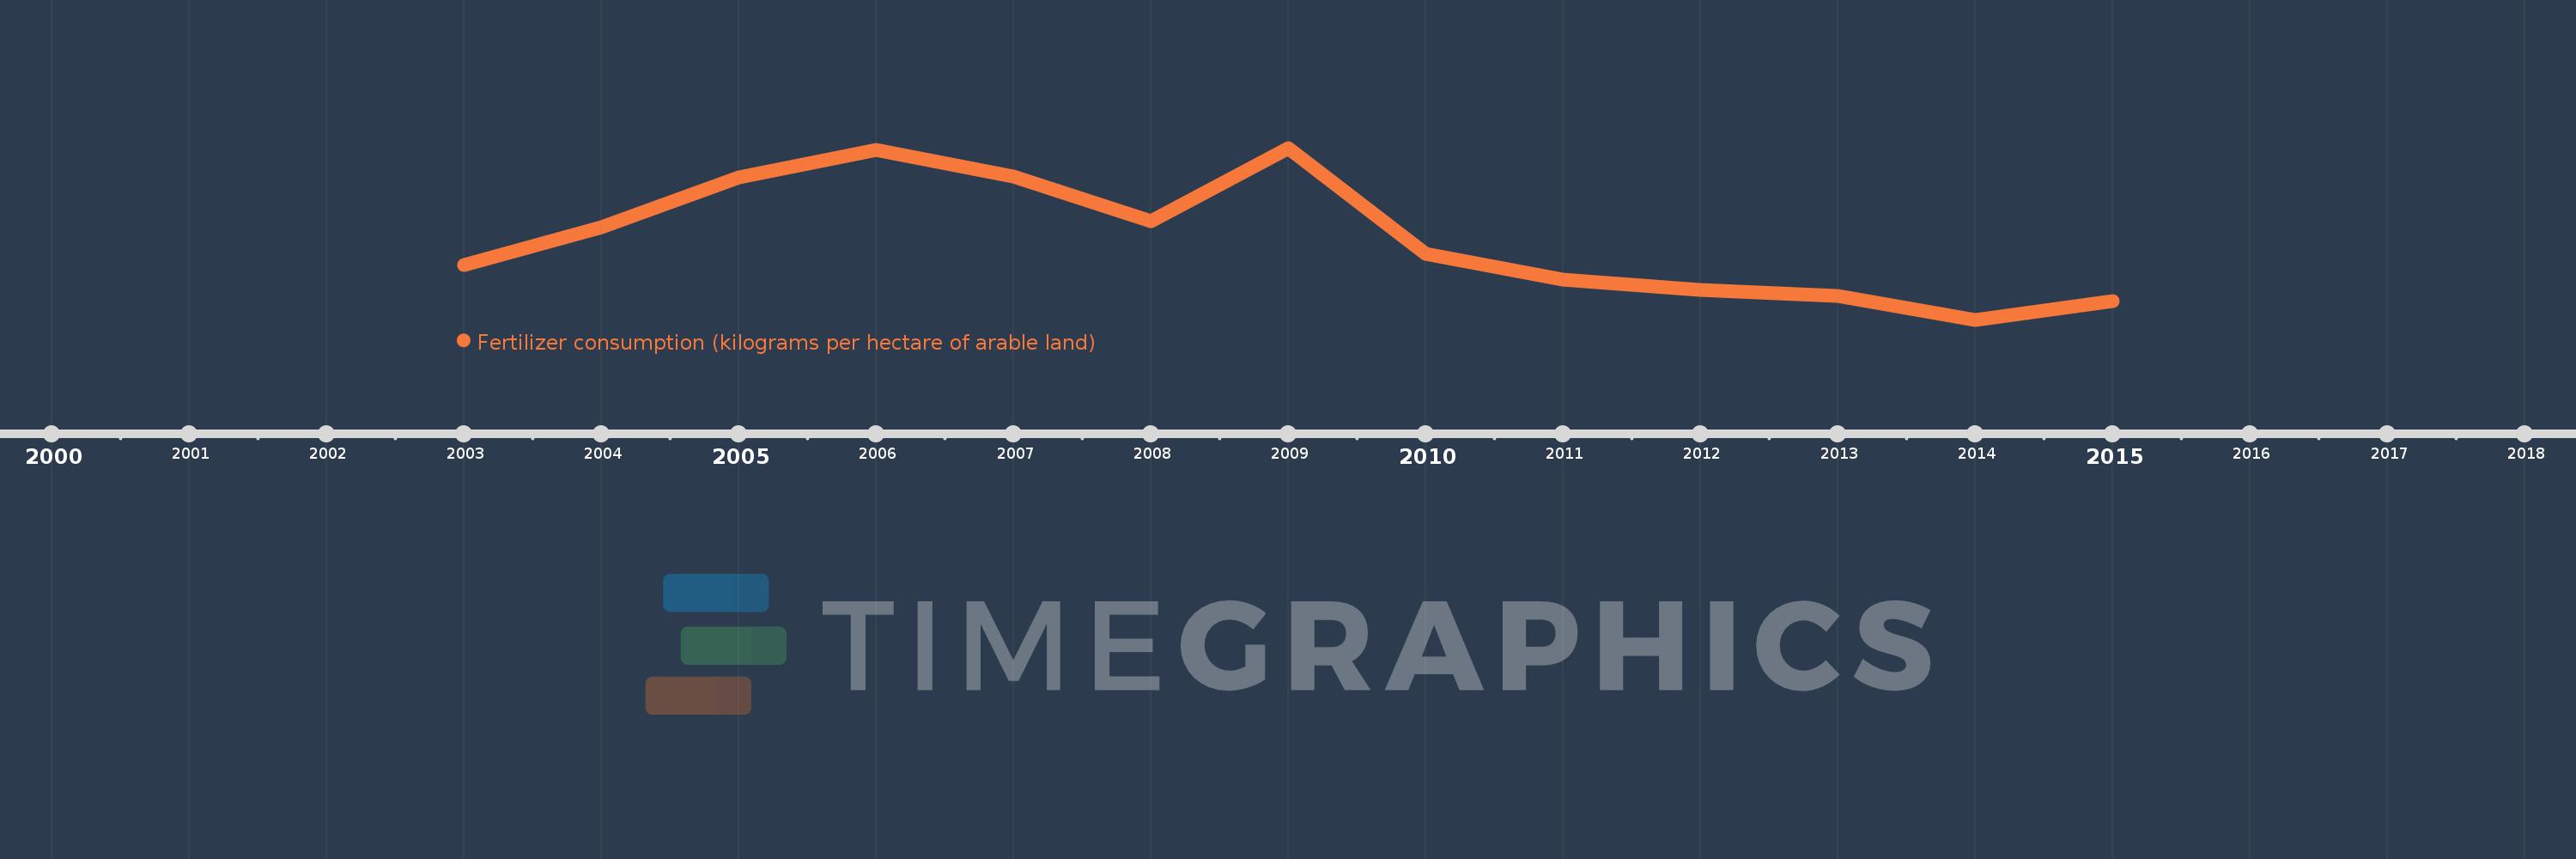
This timeline shows a graph from 2003 to 2015 of Middle East & North Africa (excluding high income). No data until 2002. Number of actual observations by date: 13.
Source name:
World Development Indicators
Source organization:
Food and Agriculture Organization, electronic files and web site.
Categories, topics:
Agriculture & Rural Development
Last updated:
apr 23, 2017
Indicators value changes by year
Meaning:
83.925
Minimum:
71.143
jan 1, 2014
Maximum:
98.337
jan 1, 2009
At the date of observation
Value
Absolute change
Change from the previous value
jan 1, 2003
79.789
+79.789
0.0%
jan 1, 2004
85.732
+5.942
7.45%
jan 1, 2005
93.607
+7.875
9.19%
jan 1, 2006
98.037
+4.43
4.73%
jan 1, 2007
93.812
-4.225
-4.31%
jan 1, 2008
86.758
-7.054
-7.52%
jan 1, 2009
98.337
+11.579
13.35%
jan 1, 2010
81.586
-16.751
-17.03%
jan 1, 2011
77.441
-4.145
-5.08%
jan 1, 2012
75.794
-1.647
-2.13%
jan 1, 2013
74.903
-0.891
-1.18%
jan 1, 2014
71.143
-3.76
-5.02%
jan 1, 2015
74.088
+2.945
4.14%
Ranking of countries by current statistics by years