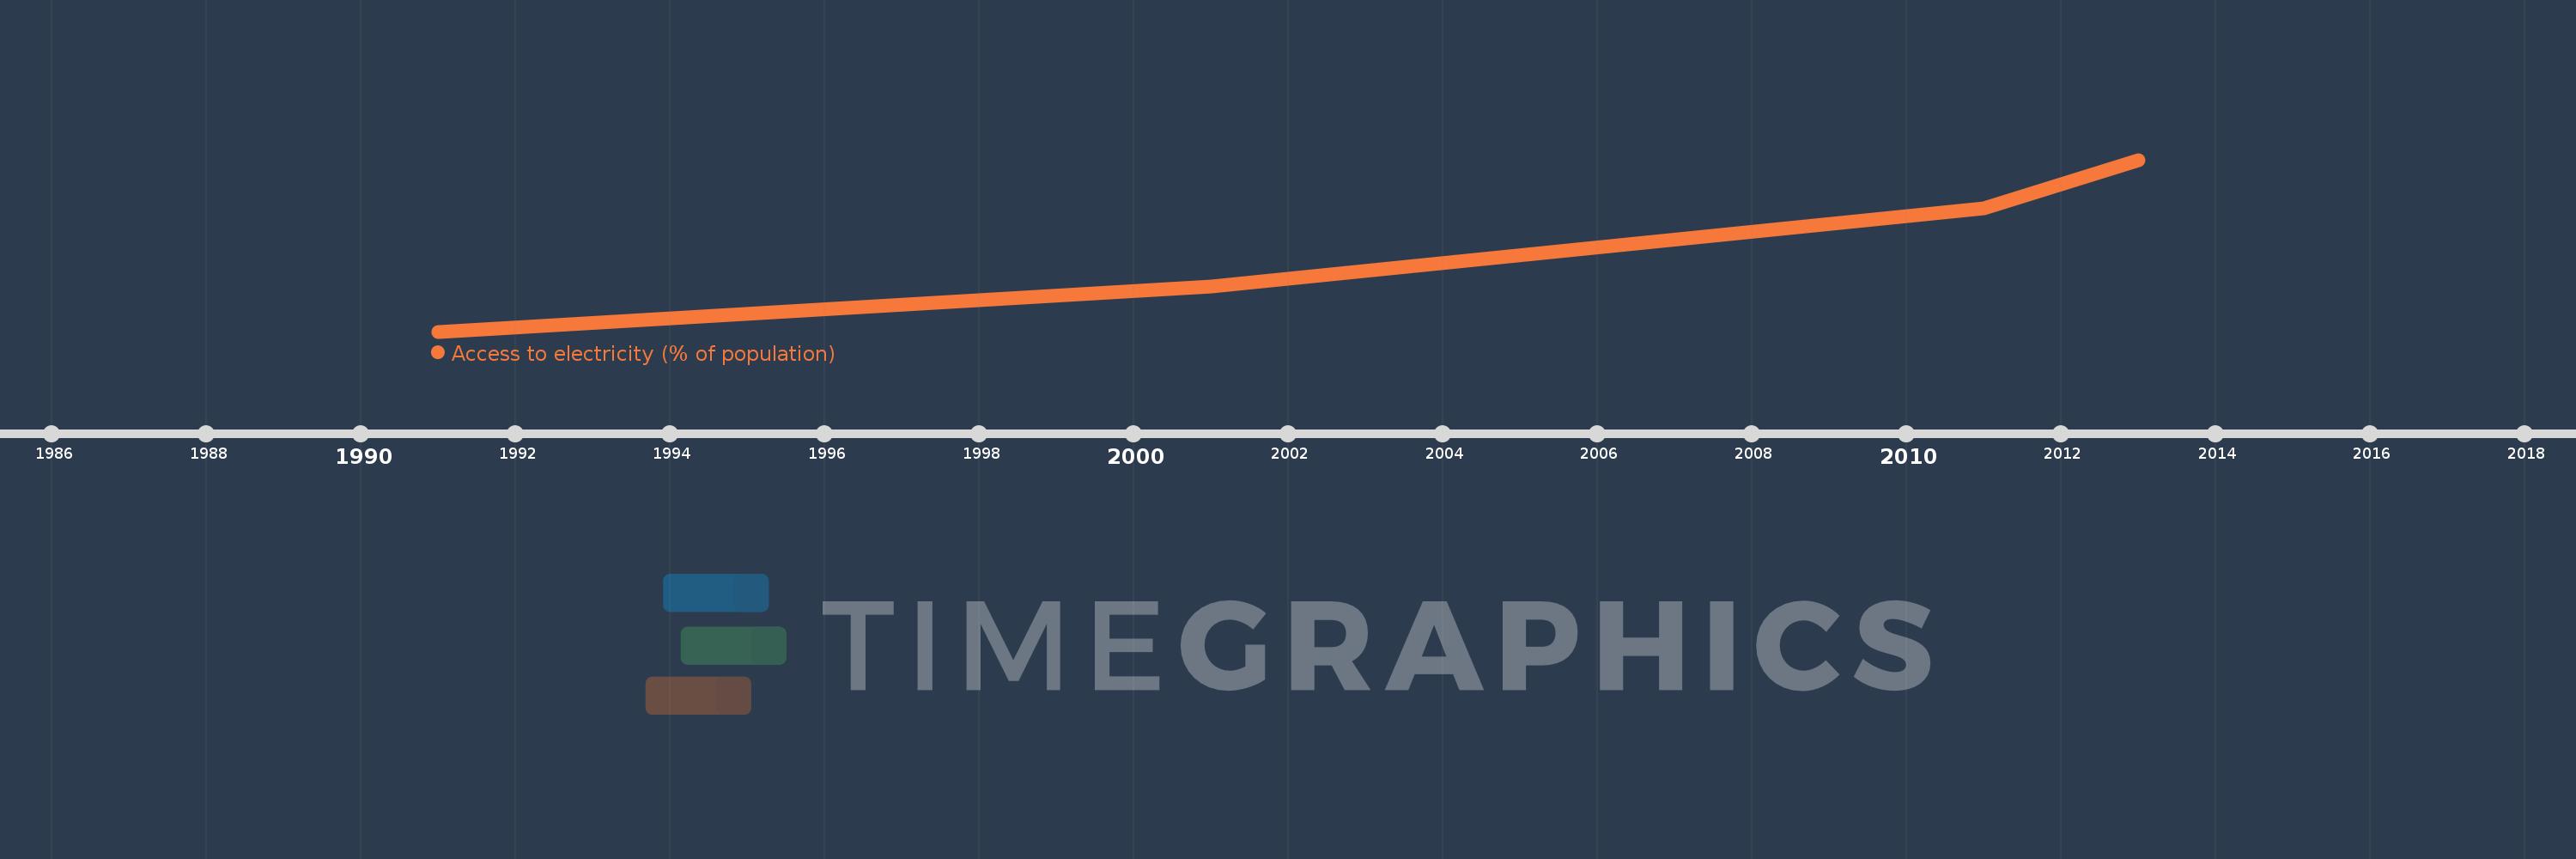
This timeline shows a graph from 1991 to 2013 of Sub-Saharan Africa (IDA & IBRD countries). No data until 1990. Number of actual observations by date: 4.
Source name:
World Development Indicators
Source organization:
World Bank, Sustainable Energy for All (SE4ALL) database from World Bank, Global Electrification database.
Categories, topics:
Energy & Mining, Climate Change, Environment
Last updated:
apr 23, 2017
Indicators value changes by year
Meaning:
28.979
Minimum:
22.772
jan 1, 1991
Maximum:
35.307
jan 1, 2013
At the date of observation
Value
Absolute change
Change from the previous value
jan 1, 1991
22.772
+22.772
0.0%
jan 1, 2001
26.065
+3.293
14.46%
jan 1, 2011
31.772
+5.707
21.9%
jan 1, 2013
35.307
+3.535
11.13%
Ranking of countries by current statistics by years